New Relic Kubernetes Monitoring
New Relic Kubernetes Monitoring provides visibility into cluster health and workloads across on-premises, cloud, and hybrid environments.
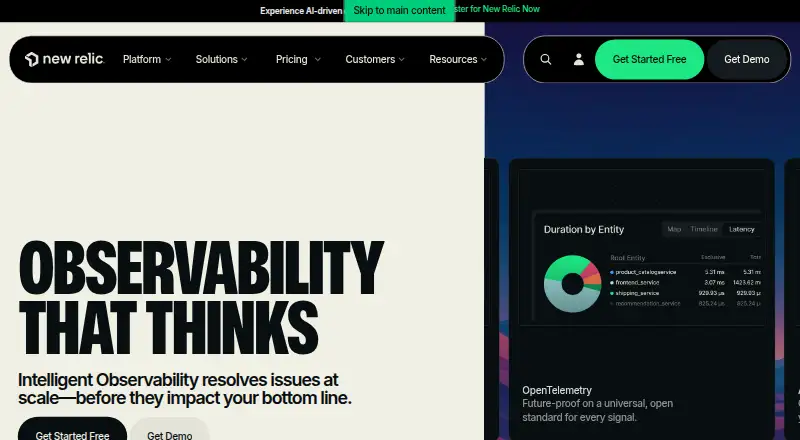
What New Relic Kubernetes Monitoring is
New Relic Kubernetes Monitoring provides visibility into cluster health and workloads across on-premises, cloud, and hybrid environments. Its cluster explorer brings together metrics, events, logs, and traces for control plane components, nodes, namespaces, deployments, replica sets, pods, and containers. Teams can forward Kubernetes logs and events for exploration, queries, and alerting, and use service discovery to collect Prometheus metrics. Linking application performance data with Kubernetes data helps examine request rates, throughput, errors, and availability. The integration includes predefined and custom alerts and can report data that triggers pod autoscaling. It can also monitor supported services such as Apache, Kafka, MySQL, NGINX, and Redis. Installation requires a New Relic license key and uses Helm or manifests. The default configuration uses a privileged Infrastructure Agent sidecar for deep host metrics; unprivileged mode is available with reduced host visibility. A perpetual free tier includes 100 GB monthly ingest and one full platform user. The listed Pro plan is $349 a year.
Good
- Covers cluster components from control plane to containers.
- Collects metrics, logs, traces, and events.
- Links application performance data with Kubernetes data.
- Includes predefined and custom Kubernetes alerts.
Watch out
- Installation requires a New Relic license key.
- Default configuration uses a privileged agent sidecar.
- Unprivileged mode reduces host visibility.
Who it suits
It suits teams operating Kubernetes clusters who need to troubleshoot application and infrastructure behavior, including at scale. Teams should account for the privileged default agent configuration or the reduced host visibility of unprivileged mode.
Verdict
New Relic Kubernetes Monitoring brings cluster telemetry and application performance data into a shared view, with alerting and autoscaling support. Its default privileged sidecar and license-key requirement are important deployment considerations.
Plans and prices
From New Relic Kubernetes Monitoring's own pricing page, checked 30 Sep 2026.
| Plan | Price | What it gives you |
|---|---|---|
| Free | Free | 100 GB/month ingest · one free full platform user · unlimited basic users · default data retention · Perpetual free tier; 100 GB of data ingest per month included. |
| Enterprise | Priced on request | Custom pricing · FedRAMP Moderate and HIPAA eligibility with Data Plus · priority ticket routing · 1-hour critical initial support response SLA · Contact sales for pricing. |
| Pro | — | Unlimited full platform users · commitment options · 2-hour critical initial support response SLA · optional full consumption pricing · Usage-based; data ingest is $0.40/GB beyond the free 100 GB limit, or $0.60/GB with Data Plus. |
| Standard | — | Limited to 5 full platform users · ticketed support · 2 business days support response SLA · SAML single sign-on · Usage-based; data ingest is $0.40/GB beyond the free 100 GB limit, or $0.60/GB with Data Plus. |
The facts
Each one read from New Relic Kubernetes Monitoring's own pages, with the date it was checked.
What it does
- Alerting and scaling
- It includes predefined alert conditions, supports custom Kubernetes alerts, and can report data that triggers pod autoscaling.checked 30 Sep 2026
- Cluster visibility
- The cluster explorer presents Kubernetes metrics, events, logs, and traces in a multidimensional view.checked 30 Sep 2026
- Coverage
- The integration collects data about control plane components, nodes, namespaces, deployments, replica sets, pods, and containers.checked 30 Sep 2026
- Installation
- The Kubernetes integration requires a New Relic license key and supports installation using Helm or manifests.checked 30 Sep 2026
- Logs and events
- It can forward Kubernetes logs and events to New Relic for exploration, querying, and alerting, with event reporting installed by default.checked 30 Sep 2026
- Notable requirement
- The default Kubernetes integration configuration uses a privileged Infrastructure Agent sidecar to collect deep host metrics, though unprivileged mode is available with reduced host visibility.checked 30 Sep 2026
- Prometheus
- The Prometheus Agent uses service discovery to scrape Prometheus metrics from workloads in a Kubernetes cluster.checked 30 Sep 2026
- Purpose
- The Kubernetes integration provides visibility into cluster health and workloads across on-premises, cloud, and hybrid environments.checked 30 Sep 2026
- Security and compliance
- New Relic lists FedRAMP, HIPAA-enabled capabilities, ISO 27001, ISO 42001, PCI DSS, SOC 1, SOC 2, and TISAX among its current certifications or attestations, while noting individual services may not all be in scope.checked 30 Sep 2026
- Service integrations
- The Kubernetes integration can monitor supported services including Apache, Cassandra, Elasticsearch, Kafka, MongoDB, MySQL, NGINX, PostgreSQL, RabbitMQ, and Redis.checked 30 Sep 2026
- Support
- Standard includes ticketed support with a two-business-day response SLA, while Pro and Enterprise list critical initial response SLAs of two hours and one hour respectively.checked 30 Sep 2026
- Supported environments
- The integration supports Kubernetes environments hosted on-premises or in the cloud, and compatibility documentation lists GKE, EKS, AKS, OKE, and OpenShift among supported platforms.checked 30 Sep 2026
- Who it is for
- The product is aimed at teams operating Kubernetes clusters who need to troubleshoot application and infrastructure behavior, including at scale.checked 30 Sep 2026
Where it runs
- Application correlation
- Users can link APM data to Kubernetes data to examine application request rate, throughput, error rate, and availability.checked 30 Sep 2026
The company
- Founded
- 2008checked 28 Sep 2026
- Headquarters
- San Francisco, California, USAchecked 28 Sep 2026
The full review of New Relic Kubernetes Monitoring
Overview
New Relic Kubernetes Monitoring is a Kubernetes integration for teams that need to investigate workload and infrastructure behavior across on-premises, cloud, and hybrid clusters. It is most compelling when operators want cluster telemetry and application performance data in one workflow, rather than separate tools for each layer. The main trade-off is operational: installation needs a New Relic license key, and the default configuration runs a privileged agent sidecar.
Key features
The cluster explorer organizes metrics, events, logs, and traces across control plane components, nodes, namespaces, deployments, replica sets, pods, and containers. That breadth gives operations teams several levels at which to trace a fault, from a cluster-wide change to a specific workload. Kubernetes logs and events can be forwarded for searching, querying, and alerting, and event reporting is enabled by default.
For Prometheus workloads, the Prometheus Agent discovers services and scrapes their metrics. Kubernetes data can also be connected to APM request rate, throughput, error rate, and availability, which helps teams distinguish application symptoms from infrastructure causes. Integrations cover services including Apache, Cassandra, Elasticsearch, Kafka, MongoDB, MySQL, NGINX, PostgreSQL, RabbitMQ, and Redis.
Predefined and custom Kubernetes alert conditions help teams respond to resource and service issues; reported data can also trigger pod autoscaling. Installation is supported through Helm or manifests. The default configuration uses a privileged Infrastructure Agent sidecar for deeper host metrics; unprivileged mode is an option, but it provides reduced host visibility. That is a meaningful choice for teams with tighter privilege requirements.
Supported environments include on-premises and cloud Kubernetes, with compatibility for GKE, EKS, AKS, OKE, and OpenShift. New Relic lists certifications and attestations including FedRAMP, HIPAA-enabled capabilities, ISO 27001, ISO 42001, PCI DSS, SOC 1, SOC 2, and TISAX, while noting that not every service is necessarily in scope.
Pricing
The perpetual Free plan costs nothing and includes 100 GB of data ingest per month, one full platform user, unlimited basic users, and default data retention. It is a practical starting point for smaller teams, but the full-platform-user allowance is restrictive when several operators need that level of access.
Standard uses usage-based billing and has custom pricing. It limits access to five full platform users and includes ticketed support with a two-business-day response SLA and SAML single sign-on. Ingest beyond the free 100 GB limit is $0.40/GB, or $0.60/GB with Data Plus. Pro costs $349 a year, billed for annual commitments, and includes unlimited full platform users, 100 GB of free data ingest, and $0.40/GB beyond that limit. It is a clearer fit for larger teams that need unrestricted full-user access, but the annual commitment is less flexible.
Enterprise has custom pricing and is billed by contacting sales. It adds priority ticket routing, a one-hour critical initial support response SLA, and FedRAMP Moderate and HIPAA eligibility with Data Plus. Teams with regulated workloads or urgent support needs may find those terms worth considering; smaller deployments may not need them. The stated paid-from price is 10 /user/mo, while the plans also describe usage-based ingest charges and annual commitments, so buyers should match the billing structure to expected users and data volume.
Platforms
The integration supports Kubernetes, as well as Docker on Linux and Windows. New Relic's listed platforms include Linux, Windows, web, and self-hosted deployments. The deployment model is hybrid, which suits organizations spanning their own infrastructure and cloud environments.
Who it's for
This is a strong candidate for teams operating Kubernetes at scale that need to troubleshoot application and infrastructure behavior together, especially when Prometheus metrics, logs, events, and APM context all matter. It is less suitable for teams that cannot grant the default agent privileged access and are unwilling to accept reduced host visibility, or for organizations seeking a standalone cluster monitor without New Relic licensing.
Pros and cons
- Pros: Broad cluster coverage brings telemetry from control plane through containers into one explorer.
- Pros: APM correlation and Prometheus scraping connect workload metrics with application symptoms.
- Pros: Predefined and custom alerts, plus autoscaling-trigger data, support both response and capacity actions.
- Cons: Installation requires a New Relic license key, adding a platform dependency.
- Cons: Deep host metrics use a privileged sidecar by default; unprivileged mode sacrifices host visibility.
- Cons: Free includes only one full platform user, while Standard caps that access at five.
Alternatives
Dynatrace Kubernetes Monitoring is worth comparing if a paid offering with a free trial and hourly pod-based billing better suits the deployment. For broader device and server operations, ManageEngine OpManager offers a perpetual free edition for three devices, while AWS Systems Manager State Manager has no additional charge, though limits may apply.
Riverbed Aternity is an enterprise digital experience management option with custom pricing. Elastic Observability has a free plan and trial, with usage-based serverless pricing. New Relic Session Replay is a related New Relic option with a free plan and session replay among its platform capabilities, rather than a Kubernetes-monitoring alternative.
Site24x7 Server Monitoring offers a free plan and trial, with a paid annual Lite plan starting at $9 a month. Sumo Logic provides a free plan with 20 daily credits, seven-day log retention, and up to three users. Readers comparing broader categories can also browse IT Operations Management Software, Synthetic Monitoring, Real User Monitoring, Database Monitoring, Application Dependency Mapping Software, and Observability Platforms.
Verdict
Choose New Relic Kubernetes Monitoring if your team needs cluster telemetry tied directly to application performance and wants alerting and autoscaling support in the same environment. Its coverage across workloads and services is the central reason to choose it. Look elsewhere if licensing, privileged collection, or the full-user limits on lower tiers conflict with your security posture or team size.
Getting started
- Create or use a New Relic account and obtain a license key.
- Choose a supported Kubernetes environment, such as GKE, EKS, AKS, OKE, or OpenShift.
- Install the integration using Helm or manifests.
- Select the default privileged configuration or unprivileged mode with reduced host visibility.
- Start with the free tier or review the available paid plans.
Limits worth knowing
The free tier includes 100 GB of data ingest per month and one full platform user, with unlimited basic users and default data retention. Standard limits full platform users to five; usage beyond the free 100 GB is charged at $0.40/GB, or $0.60/GB with Data Plus.
Questions
Is there a free plan?
Yes. The perpetual free tier includes 100 GB of monthly data ingest, one full platform user, unlimited basic users, and default data retention.
What does New Relic Kubernetes Monitoring cost?
The listed free plan is free. Pro is $349 a year for annual commitments; Standard and Enterprise have no listed price. The pricing note says paid plans start from $0.01, while the paid-from field says 10 /user/mo.
Which Kubernetes environments does it support?
It supports on-premises and cloud Kubernetes environments. Compatibility documentation lists GKE, EKS, AKS, OKE, and OpenShift.
How is the integration installed?
Installation requires a New Relic license key and supports Helm or manifests.
Does it support Prometheus metrics and alerts?
Yes. The Prometheus Agent uses service discovery to scrape workload metrics. Predefined and custom Kubernetes alerts are available.
Does it use a privileged agent?
The default configuration uses a privileged Infrastructure Agent sidecar to collect deep host metrics. An unprivileged mode is available with reduced host visibility.
Alternatives to New Relic Kubernetes Monitoring
- 1

Checkmk
Free planOpen sourceAndroidiOSWebAPI8.8From $275 a month - 2
Netdata
Free planOpen sourceAndroidiOSWebAPI8.7From $4.50 a month - 3
Grafana Cloud Application Observability
Free planAndroidiOSWebAPI8.4From $0.03 a month - 4
Coroot
Free planOpen sourceWebAPILinuxSelf-hosted8.2From $1 a month - 5

Middleware
Free planAndroidiOSWebAPI8.2$0.30 usage-based - 6

SigNoz
Free planAndroidiOSWebAPI7.6From $19 a month