Netdata
Netdata is an observability platform for monitoring infrastructure and investigating problems in real time.
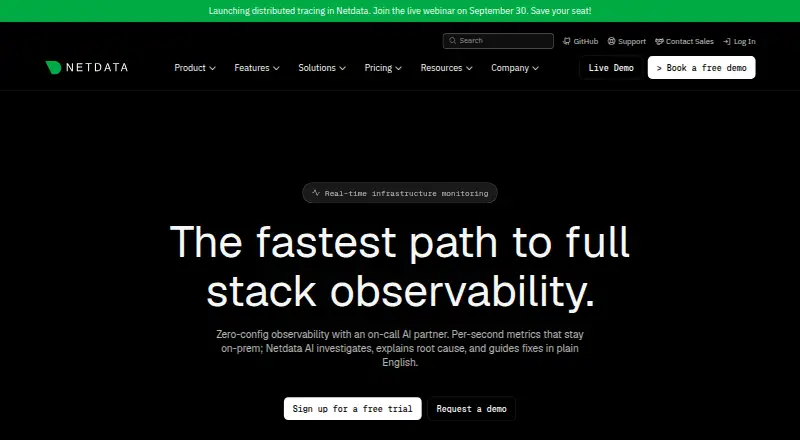
What Netdata is
Netdata is an observability platform for monitoring infrastructure and investigating problems in real time. Its agent collects metrics and logs, supports per-second monitoring, and provides dashboards, alerts, and machine-learning anomaly detection. Netdata lists more than 800 collectors and notification channels, including Slack, PagerDuty, Microsoft Teams, email, and webhooks. It can ingest Prometheus, OpenMetrics, StatsD, and OpenTelemetry data, and export to Prometheus Remote Write, InfluxDB, Graphite, OpenTSDB, and TimescaleDB. Organizations can choose Netdata’s managed cloud service or an on-premises deployment, including air-gapped options. Netdata says metrics stay on the user’s infrastructure while only metadata reaches the cloud. Native Android and iOS apps provide alerts and notifications. The Community plan is free, with up to five active connected nodes and one active custom dashboard per room. Netdata Cloud sign-up includes a 14-day Business trial for any number of nodes. Business costs $4.50 per month billed annually, with a stated total of $540.00 per year.
Good
- Per-second metrics and machine-learning anomaly detection.
- More than 800 collectors and notification channels.
- Managed cloud, on-premises, and air-gapped deployment options.
- Native Android and iOS apps provide alerts.
Watch out
- Community is limited to five active connected nodes.
- Community allows one active custom dashboard per room.
- Business is $4.50/month billed annually.
Who it suits
Netdata suits platform engineers, DevOps and SRE teams, developers, system administrators, and others who need infrastructure monitoring. It also serves users who want on-premises or air-gapped deployment options.
Verdict
Netdata combines infrastructure monitoring, troubleshooting, dashboards, and alerts with broad integration and deployment choices. Check the Community node and dashboard limits against your needs before choosing a plan.
Plans and prices
From Netdata's own pricing page, checked 15 Oct 2026.
| Plan | Price | What it gives you |
|---|---|---|
| Community | Free | 5 active connected nodes · 1 active custom dashboard per room · personal non-commercial use · free forever |
| Business | $4.50 a month | unlimited metrics and logs · unlimited dashboards · unlimited retention · RBAC · SSO · SCIM · audit logs · $4.50/node/month; $540.00/year shown |
| Homelab | $90 a year | unlimited nodes · fair-use policy · $90/year |
| Enterprise On-Premise | Priced on request | starts at 200 node licenses · all components hosted on premises · air-gapped deployment · contact sales |
The facts
Each one read from Netdata's own pages, with the date it was checked.
What it does
- Agent
- The agent provides metrics and logs, machine learning, dashboards, and alerts, with the site claiming 800+ integrations.checked 30 Sep 2026
- Alerting
- The agent includes hundreds of preconfigured alerts and notifications for channels such as email, Slack, Telegram, PagerDuty and Microsoft Teams.checked 15 Oct 2026
- API
- An Agent REST API exposes metrics, alerts and configuration, while a Cloud REST API covers spaces, rooms and nodes.checked 15 Oct 2026
- API documentation limit
- Netdata states that its Cloud API documentation is still a work in progress and that more endpoints are planned.checked 15 Oct 2026
- API tooling
- The Agent API is documented with OpenAPI and can be explored through Swagger UI and Swagger Editor; Cloud API documentation is interactive.checked 15 Oct 2026
- Data architecture
- Metrics and processing remain on monitored infrastructure while Netdata Cloud provides centralized views and control functions.checked 15 Oct 2026
- Data formats
- The agent page lists Prometheus, OpenMetrics, StatsD, and OpenTelemetry ingestion, and Prometheus Remote Write, InfluxDB, Graphite, OpenTSDB, and TimescaleDB export.checked 30 Sep 2026
- Data sovereignty
- Netdata says metrics stay on the user's infrastructure and only metadata reaches the cloud.checked 30 Sep 2026
- Deployment
- Netdata offers a managed cloud platform and an on-premises deployment, including air-gapped deployment options.checked 30 Sep 2026
- Deployment options
- Documentation lists Linux, Windows, macOS, FreeBSD, Docker, Kubernetes, pfSense, Synology, Ansible, AWS, Azure and GCP installation paths.checked 15 Oct 2026
- Documentation and support
- The documentation covers deployment, configuration, collectors, alerting, exporting, troubleshooting and developer APIs, with forums, Discord and GitHub discussions available.checked 15 Oct 2026
- Extensibility
- The project describes a modular plugin and collector architecture that supports custom metrics and integrations with other monitoring systems.checked 15 Oct 2026
- Integrations
- Netdata advertises more than 800 collectors and notification integrations, including operating systems, databases, containers, cloud services, OpenMetrics, StatsD and logs.checked 15 Oct 2026
- Intended users
- The site lists platform engineers, DevOps teams, SREs, developers, system administrators, CISOs, DBAs, network engineers, and MSPs among its audiences.checked 30 Sep 2026
- Latest release
- Version 2.12.1 was released on October 8, 2026 to fix a Windows startup crash, a timezone bug, eBPF stability issues and collector performance problems.checked 15 Oct 2026
- License
- The Netdata Agent repository is marked GPL-3.0, while the Netdata UI is distributed under the NCUL1 license.checked 15 Oct 2026
- Limit: Capterra pricing
- One Capterra reviewer says the per-node cloud pricing is too expensive for many enthusiast users.checked 15 Oct 2026
- Limit: Capterra setup
- A reviewer reports that systemd monitoring was not enabled out of the box and took about five hours to configure and automate with Ansible.checked 15 Oct 2026
The company
- Company headquarters
- Crunchbase lists Netdata headquarters in San Francisco, California, United States.checked 15 Oct 2026
- Company legal name
- Crunchbase lists the legal entity as Netdata, Inc.checked 15 Oct 2026
- Founded
- 2016checked 28 Sep 2026
- Headquarters
- San Francisco, California, United Stateschecked 28 Sep 2026
Money
- Free plan limits
- The Community plan is limited to five active connected nodes and one active custom dashboard per room.checked 30 Sep 2026
Where it runs
- Limit: Android app
- Google Play reviewers report that free-tier users cannot use core mobile functionality because notifications are restricted to paid plans.checked 15 Oct 2026
The full review of Netdata
Netdata is a real-time infrastructure observability platform that brings metrics, logs, dashboards, and alerts together. It is best suited to teams that need broad infrastructure coverage and flexible deployment, including on-premises or air-gapped environments. Its strongest case is the combination of per-second monitoring, a large integration catalog, and a generous no-cost trial; its Community plan’s five-node ceiling is the first constraint to check.
Overview
Netdata targets infrastructure monitoring and troubleshooting, with VM and service monitoring and support for Linux and Windows. The agent supports per-second metrics and ML-based anomaly detection, a useful pairing for teams that need to spot changes quickly and investigate them in the same platform.
Deployment can be through managed Netdata Cloud or on-premises, including air-gapped setups. Netdata says metrics stay on the user's infrastructure and only metadata reaches the cloud, which can suit organizations with data-sovereignty requirements. Its native iOS and Android apps add alerts and notifications for people who need to keep up with incidents away from a desktop.
Key features
- Metrics and logs: The agent collects both and supplies dashboards and alerts, giving infrastructure teams a shared monitoring and response surface.
- Broad integrations: Netdata lists more than 800 collectors and notification channels, including Slack, PagerDuty, Microsoft Teams, email, and webhooks. That breadth can reduce friction when connecting existing systems and routing alerts.
- Interoperable data formats: Ingestion includes Prometheus, OpenMetrics, StatsD, and OpenTelemetry; export includes Prometheus Remote Write, InfluxDB, Graphite, OpenTSDB, and TimescaleDB. This makes Netdata more practical in environments that already use these formats.
- Security and access: Netdata Cloud is SOC 2 Type 2 certified. SSO and role-based access control are Business features, so organizations needing those controls should account for the paid plan.
- Support: Documentation and community support are listed, with premium support also available.
Pricing
Netdata uses a freemium model, with a 14-day trial and three plans aimed at different scales of use.
- Community — Free: Includes a maximum of five active connected nodes and one active custom dashboard per room. It is a sensible starting point for small deployments, but the node cap and dashboard restriction may rule it out for larger teams or broader visibility needs.
- Business — $4.50 per month, billed annually; $540.00 per year total: Includes unlimited metrics and logs, unlimited custom dashboards, and unlimited data retention. This is the clearer fit when Community's dashboard or node constraints are too restrictive and unlimited retention matters. The annual billing commitment is important to weigh against the monthly-equivalent price.
- Homelab — $90.00 per year: Offers unlimited nodes with fair usage. Its node allowance suits a multi-node home lab, though the fair-usage condition remains a constraint.
Signing up for Netdata Cloud provides a 14-day Business trial for any number of nodes with no limits, making it possible to assess the paid tier before committing. Documentation and community support are available, while premium support is an option for teams that need more.
Platforms
Netdata's platform list includes Android, iOS, Linux, macOS, self-hosted, web, and Windows. Monitoring coverage is stated for Linux and Windows; the broader platform list should not be mistaken for confirmation of monitoring support on every listed platform.
Who it's for
Netdata is aimed at platform engineers, DevOps teams, SREs, developers, system administrators, CISOs, DBAs, network engineers, and MSPs. It is particularly compelling for infrastructure teams that want high-frequency metrics, varied integrations, and a choice between managed cloud and self-hosted deployment. Smaller users should check whether five connected nodes and one dashboard per room are enough; organizations that require SSO or role-based access control need Business.
Pros and cons
- Pro: Per-second metrics and ML-based anomaly detection support rapid monitoring and troubleshooting.
- Pro: More than 800 collectors and notification channels, plus multiple ingestion and export formats, support varied infrastructure and data flows.
- Pro: On-premises and air-gapped deployment, with metrics kept on the user's infrastructure, gives data-sensitive organizations deployment flexibility.
- Con: Community is capped at five active nodes and one active custom dashboard per room, limiting its usefulness as an environment grows.
- Con: SSO and role-based access control are Business features, putting those access requirements behind the paid tier.
- Con: Business is billed annually at $540.00 total, despite its $4.50 monthly equivalent.
Alternatives
Choose InfluxDB if its single-node InfluxDB 3 Core or usage-based Cloud Serverless approach better matches the deployment or billing model you want.
Checkmk is worth considering if you want a free Community plan with 2000+ pre-built integrations, up to about 100 hosts, and community support.
Grafana Cloud Application Observability may fit if its Free tier's 2,232 host hours or its Pro pay-as-you-go host-hour pricing better fits your usage.
Consider Zabbix if its Silver plan's 8x5 support and one-day response are a better match for your support needs.
VictoriaMetrics is an alternative if you prefer open-source single-node or cluster versions.
Amazon CloudWatch Logs is another option if pay-as-you-go log ingestion, starting at $0.50 per month for the first 10 TB per month in US East (N. Virginia), suits your needs; rates vary by region and tier.
Prometheus is a free, open-source monitoring and alerting toolkit under the Apache 2.0 license.
SigNoz offers a self-hosted Community option, with infrastructure, storage, scaling, upgrades, and backups managed by the user.
For broader comparisons, see Metrics Monitoring Tools, Infrastructure Monitoring, Cloud Monitoring, Application Dependency Mapping Software, Kubernetes Monitoring, and Hardware Monitoring Software.
Verdict
Choose Netdata if you need real-time infrastructure monitoring with extensive integrations and the option to keep deployment on-premises or air-gapped. Its free Community tier is useful for small environments, but the five-node cap, limited dashboard allowance, and paid access controls make plan fit central to the decision. Look elsewhere if those limits or Business's annual commitment do not suit your scale or budget.
Getting started
- Visit the Netdata website and sign up for Netdata Cloud.
- Use the 14-day Business trial included with Cloud sign-up, or choose a plan.
- Deploy Netdata as a managed cloud service or on premises.
- Install the agent to collect metrics and logs, or use the listed ingestion formats.
- Add notification channels such as Slack, PagerDuty, Microsoft Teams, email, or webhooks.
Limits worth knowing
The free Community plan allows up to five active connected nodes and one active custom dashboard per room. The Homelab plan provides unlimited nodes with fair usage; the Business plan includes unlimited metrics and logs, custom dashboards, and data retention.
Questions
Does Netdata have a free plan?
Yes. The Community plan is free, with up to five active connected nodes and one active custom dashboard per room.
How much does Netdata Business cost?
Business costs $4.50 per month billed annually, with a stated total of $540.00/year.
Is there a free trial?
Yes. Signing up for Netdata Cloud provides a 14-day Business trial for any number of nodes with no limits.
Can Netdata run on premises?
Yes. Netdata offers on-premises deployment, including air-gapped options, as well as a managed cloud platform.
Which data formats does the agent support?
The agent ingests Prometheus, OpenMetrics, StatsD, and OpenTelemetry data. It exports to Prometheus Remote Write, InfluxDB, Graphite, OpenTSDB, and TimescaleDB.
Which platforms and audiences does Netdata list?
Platforms include Android, iOS, Linux, macOS, self-hosted, web, and Windows. Listed audiences include platform engineers, DevOps teams, SREs, developers, system administrators, CISOs, DBAs, network engineers, and MSPs.
Alternatives to Netdata
- 1
Grafana Cloud Application Observability
Free planAndroidiOSWebAPI8.4From $0.03 a month - 2

Uptrace
Free planOpen sourceWebAPILinuxmacOS8.4From $39 a month - 3
Coroot
Free planOpen sourceWebAPILinuxSelf-hosted8.2From $1 a month - 4

Middleware
Free planAndroidiOSWebAPI8.2$0.30 usage-based - 5

Embrace
Free planAndroidiOSWebAPI8.1$0.80 usage-based - 6

BugSnag
Free planAndroidiOSWebAPI7.8Free plan