Coroot
Coroot is an open-source observability platform that uses eBPF to collect metrics, logs, traces and profiling data without code changes.
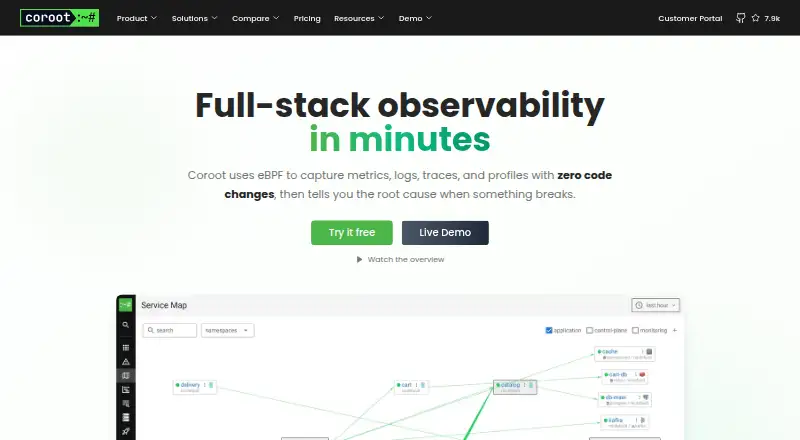
What Coroot is
Coroot is an open-source observability platform that uses eBPF to collect metrics, logs, traces and profiling data without code changes. It automatically maps services and dependencies, combining eBPF auto-instrumentation with OpenTelemetry SDK traces for end-to-end request tracking. Continuous profiling can identify CPU spikes down to the exact line of code. Coroot also tracks cloud costs without requiring cloud-account access and supports AWS, GCP, Azure and other cloud or on-premises environments. Risk detection highlights issues such as single-instance applications, unreplicated databases, poor replica placement and publicly exposed services. Its AI root cause analysis correlates metrics, logs, traces, events and profiles to identify likely causes, show evidence and suggest fixes. Notifications can be sent to Slack, Microsoft Teams, PagerDuty, Opsgenie and webhooks. Deployment targets include Kubernetes, OpenShift, Docker, Docker Swarm, Ubuntu, Debian, RHEL, CentOS and Windows agents. Coroot is self-hosted, keeping data in the customer’s infrastructure. Community Edition is Apache 2.0 licensed and free. Standard costs $1 per monitored CPU core per month, with no ingestion fees, while Premium adds 24×7 and phone support.
Good
- Collects metrics, logs, traces and profiles without code changes
- Automatic service and dependency mapping
- CPU profiling down to the exact code line
- Cloud-cost tracking without cloud-account access
- AI analysis correlates telemetry and suggests fixes
- Self-hosted Apache 2.0 Community Edition
Watch out
- Linux deployments require kernel version 5.1 or later
- Standard is billed per monitored CPU core monthly
- Premium support features require a paid plan
Who it suits
Coroot suits engineering and operations teams that need infrastructure observability without changing application code. It also fits organisations requiring self-hosting, Kubernetes or Docker coverage, cloud-cost visibility and automated incident analysis.
Verdict
Pick Coroot when you want open-source, self-hosted observability with eBPF collection, dependency maps and automated root-cause analysis. Its broad deployment support and cloud-cost tracking suit mixed infrastructure. Look elsewhere if your Linux systems cannot meet the 5.1 kernel requirement or if per-core billing does not fit your budget.
Plans and prices
From Coroot's own pricing page, checked 30 Sep 2026.
| Plan | Price | What it gives you |
|---|---|---|
| Community Edition | Free | core features · Apache 2.0 · self-hosted |
| Community Edition / Free Open Source | Free | Core observability features · self-hosted |
| Enterprise Edition | $1 a month | All observability features · unlimited users · enterprise support · self-hosted · per monitored CPU core/month |
| Standard | $1 a month | volume discounts · business-hours support · no ingestion fees · per monitored CPU core/month |
| Pro | $25 a month | Plan details not provided · per month |
| Premium | Priced on request | 24×7 support · phone support · premium onboarding · air-gapped installation support |
| Enterprise | Priced on request | Custom terms · contact sales |
The facts
Each one read from Coroot's own pages, with the date it was checked.
What it does
- AI model integrations
- Enterprise AI configuration supports Anthropic, OpenAI and OpenAI-compatible endpoints including tested Google Gemini and DeepSeek connections.checked 19 Oct 2026
- AI root cause analysis
- Coroot correlates metrics, logs, traces, events and profiles to identify likely incident causes and provide evidence and suggested fixes.checked 30 Sep 2026
- AI root-cause analysis
- AI RCA is available in Enterprise or through Coroot Cloud integration, which provides Community Edition users with 10 free investigations per month.checked 19 Oct 2026
- Alert integrations
- Alert notifications can be routed to Slack, Microsoft Teams, PagerDuty, Opsgenie or a customizable webhook.checked 19 Oct 2026
- API access change
- Release 1.26.8 added service accounts and user API keys for programmatic access to the MCP endpoint and API.checked 19 Oct 2026
- Continuous profiling
- Its profiler continuously profiles node processes and can associate profiles with container metadata.checked 19 Oct 2026
- Deployment targets
- Coroot supports Kubernetes, OpenShift, Docker, Docker Swarm, Ubuntu, Debian, RHEL, CentOS and Windows agents.checked 30 Sep 2026
- Deployment tracking
- Coroot discovers Kubernetes rollouts, compares releases and can show the cloud-cost effect of a deployment.checked 19 Oct 2026
- Distributed tracing
- The node agent can capture outbound requests with eBPF and export them as OpenTelemetry spans when applications lack instrumentation.checked 19 Oct 2026
- Documentation depth
- The public documentation includes installation guides, architecture, alerting, profiling, tracing, cost monitoring, risk monitoring, configuration and MCP/API authentication.checked 19 Oct 2026
- Funding
- Crunchbase lists Coroot as private, pre-seed and records one pre-seed funding round with NC Tweener Fund as investor.checked 19 Oct 2026
- Legal name
- Crunchbase identifies the legal name as Coroot Inc.checked 19 Oct 2026
- License
- The Coroot repository is licensed under Apache License 2.0.checked 19 Oct 2026
- Limit: access controls
- A G2 reviewer says authentication and authorization would be useful additions.checked 19 Oct 2026
- Limit: log and trace storage
- G2 reviewers report missing or insufficient backend storage for logs and traces, and one reports log data not appearing as expected.checked 19 Oct 2026
- Limit: scalability maturity
- A G2 reviewer cites a lack of production-ready configurations for larger deployments.checked 19 Oct 2026
Where it runs
- Application health
- The platform provides real-time service health summaries, log correlation and SLO tracking.checked 19 Oct 2026
- Linux requirement
- Coroot requires a minimum supported Linux kernel version of 5.1 because it relies heavily on eBPF.checked 30 Sep 2026
Money
- Cloud cost insights
- Coroot tracks cloud costs without cloud-account access and supports AWS, GCP, Azure and other cloud or on-premises environments.checked 30 Sep 2026
- Cloud cost monitoring
- Cost monitoring supports AWS, GCP and Azure pricing models and can allocate usage, allocation and overprovisioning costs to applications.checked 19 Oct 2026
The company
- Company founding
- LinkedIn lists Coroot as founded in 2021.checked 19 Oct 2026
- Company headquarters
- LinkedIn lists the headquarters as Palo Alto, California.checked 19 Oct 2026
- Company size
- LinkedIn lists Coroot as a privately held software-development company with 2–10 employees.checked 19 Oct 2026
- Founded
- 2021checked 23 Sep 2026
The full review of Coroot
Coroot is a self-hosted, open-source observability platform that combines eBPF collection with tracing, profiling, service maps and infrastructure analysis. It is best suited to teams running mixed Kubernetes, container and virtual-machine environments that want telemetry to remain in their own infrastructure. The principal compromises are its Linux kernel requirement and Standard plan’s per-core pricing.
Overview
Founded in 2021, Coroot brings metrics, logs, traces, profiles, runtime events and container logs into one operational view without requiring application code changes. The Community Edition is Apache 2.0 licensed, with transparent source code and deployment on premises or in a customer cloud. Self-hosting is valuable for organizations with data-residency or control requirements, but it also makes deployment and maintenance part of the customer’s responsibility.
Coroot is broader than a single-purpose profiler or dashboard. It connects application behavior with dependencies, cloud spending and infrastructure risks, giving platform teams a way to investigate both performance and configuration problems in the same system.
Key features
Service maps and tracing
Automatic service and dependency mapping, advertised with 100% coverage, removes much of the manual work involved in documenting distributed systems. Distributed tracing combines eBPF auto-instrumentation with OpenTelemetry SDK traces, allowing teams to follow requests end to end while retaining traces their applications already emit.
Profiling and root-cause analysis
Continuous profiling can identify CPU spikes down to the exact line of code, making it useful for persistent performance investigations rather than occasional snapshots. Coroot correlates metrics, logs, traces, events and profiles to identify likely incident causes, show supporting evidence and suggest fixes. That cross-signal analysis is a meaningful advantage when an alert alone does not explain an outage, although suggested causes still require operational judgment.
Infrastructure and cost insight
Risk detection flags single-instance applications, unreplicated databases, poor replica placement and publicly exposed services. Cloud-cost tracking works without cloud-account access and covers AWS, GCP, Azure and other cloud or on-premises environments, which suits organizations that need cost visibility without granting broad provider permissions.
Operations and notifications
Container metrics, resource alerts, image monitoring, runtime events and container log collection cover the practical needs of container operators. Notifications can go to Slack, Microsoft Teams, PagerDuty, Opsgenie and webhooks, fitting established incident-response workflows.
Pricing
Community Edition — free. The free self-hosted edition includes core features and Apache 2.0 licensing. It is the sensible starting point for small teams, evaluators and organizations willing to operate the platform themselves, but it does not include the commercial support tiers.
Standard — $1 a month. This price is billed per monitored CPU core per month, with volume discounts, no ingestion fees and business-hours support by email, chat or ticket. The per-core model is predictable for modest installations but can become expensive as monitored infrastructure grows; it is less suitable for highly variable or very large estates.
Premium — custom pricing. Premium adds 24×7 and phone support, premium onboarding and air-gapped installation support. It is aimed at organizations that need stronger service coverage or restricted-network deployment rather than teams seeking the lowest operating cost.
A 14-day trial is available. The published plans do not state seat quotas or renewal terms.
Platforms
Coroot supports Kubernetes, OpenShift, Docker, Docker Swarm, Ubuntu, Debian, RHEL, CentOS and Windows agents. Supported orchestrators include self-managed Kubernetes, EKS, GKE, AKS, OKE, OpenShift, K3s, MicroK8s and Docker Swarm. Because eBPF is central to collection, Linux systems must run kernel 5.1 or newer; older systems are not a fit for the platform’s main approach.
Who it's for
Choose Coroot if you operate mixed infrastructure and want open-source, self-hosted observability with automatic instrumentation, dependency maps, continuous profiling and incident analysis in one platform. It is particularly compelling for platform and SRE teams with data-control requirements or complex Kubernetes estates. Look elsewhere if managed-only delivery is essential, your Linux fleet cannot meet kernel 5.1, or monitoring costs tied to CPU cores conflict with your budget model.
Pros and cons
- Pro: eBPF collects broad telemetry without application code changes, reducing instrumentation work.
- Pro: Service maps, profiling, risk detection and AI-assisted analysis connect detection with investigation.
- Pro: Self-hosting and Apache 2.0 licensing keep data and source under customer control.
- Pro: Deployment spans major Kubernetes, container, Linux and Windows environments.
- Con: Linux kernel 5.1 is a hard requirement for eBPF-heavy collection.
- Con: Standard’s per-monitored-core billing can penalize large or rapidly scaling infrastructure.
- Con: Self-hosting requires the customer to provide the operating environment and administration.
Alternatives
Guance Container Monitoring is a freemium alternative with Android, iOS, macOS, Linux, Windows, web, API and self-hosted support; its free plan covers up to 10 hosts, 10,000 metric series per day and 10 million log records per day with seven-day rolling retention.
Middleware suits teams wanting a freemium product across mobile, desktop, web and API platforms, with a free tier offering up to 100GB of data, 1,000 RUM sessions and 20,000 synthetic checks.
Grafana Cloud Application Observability is the alternative when a hosted Grafana service and host-hour billing are preferable; its free tier includes 2,232 host hours.
LMbench is a free GPL-2.0 benchmark rather than a full observability platform.
OneUptime is a freemium, Apache 2.0 open-source platform that can be self-hosted.
Sentry Continuous Profiling is a freemium profiling option with broad desktop, mobile, web and self-hosted platform support.
Metoro Kubernetes Profiling is better suited when Kubernetes profiling is the primary requirement; its free Hobby plan covers one cluster, one user and two nodes with 28-day retention, while Scale costs $20 a month per node.
Parca is a free Apache 2-licensed option focused on continuous profiling.
Verdict
Pick Coroot for open-source, self-hosted observability that unifies eBPF telemetry, dependency mapping, profiling, cloud-cost insight and automated incident analysis across mixed infrastructure. Its strongest case is operational breadth with customer-controlled data. Choose another platform if your systems cannot run the required Linux kernel, you need a fully managed service, or per-core billing does not match your scale.
Getting started
- Open the Coroot website
- Choose Community Edition or a paid plan
- Deploy Coroot on supported Kubernetes, OpenShift, Docker, Docker Swarm, Linux or Windows environments
- Ensure Linux deployments use kernel version 5.1 or later
- Connect alert destinations such as Slack, Microsoft Teams, PagerDuty, Opsgenie or webhooks
- Use the service map, telemetry views and profiling tools
Limits worth knowing
Community Edition provides the core feature set as a self-hosted Apache 2.0 release. Standard costs $1 per monitored CPU core per month; Premium support adds 24×7, phone, onboarding and air-gapped installation assistance.
Questions
Is Coroot open source?
Yes. The Community Edition is Apache 2.0 licensed, with full source-code transparency and self-hosted deployment.
How much does Coroot cost?
Community Edition is free. Standard costs $1 per monitored CPU core per month and has no ingestion fees.
Which environments can Coroot monitor?
Coroot supports Kubernetes, OpenShift, Docker, Docker Swarm, Ubuntu, Debian, RHEL, CentOS and Windows agents.
Does Coroot require application code changes?
No. Its eBPF-based collection works without code changes, and it can also combine eBPF auto-instrumentation with OpenTelemetry SDK traces.
Where is observability data stored?
Coroot is self-hosted, so data stays within the customer’s infrastructure.
Which alert integrations are available?
Notifications can be sent through Slack, Microsoft Teams, PagerDuty, Opsgenie and webhooks.
Alternatives to Coroot
- 1
Kubeshark
Free planOpen sourceWebAPILinuxmacOS8.1From $0.40 a month - 2
Metoro Kubernetes Profiling
Free planWebAPILinuxSelf-hosted7.5From $20 a month - 3

groundcover
Free planWebLinuxSelf-hosted7.1From $30 a month - 4

DeepFlow
Free planAndroidWebAPILinux6.7Free plan - 5
Pyroscope
Free planWebLinuxmacOSWindows6.7From $19 a month - 6

Parca
Free planWebAPILinuxSelf-hosted6.6Free plan