Sentry Continuous Profiling
Sentry Continuous Profiling helps teams locate backend performance bottlenecks down to functions and lines of code, with a focus on Node.js and Python.
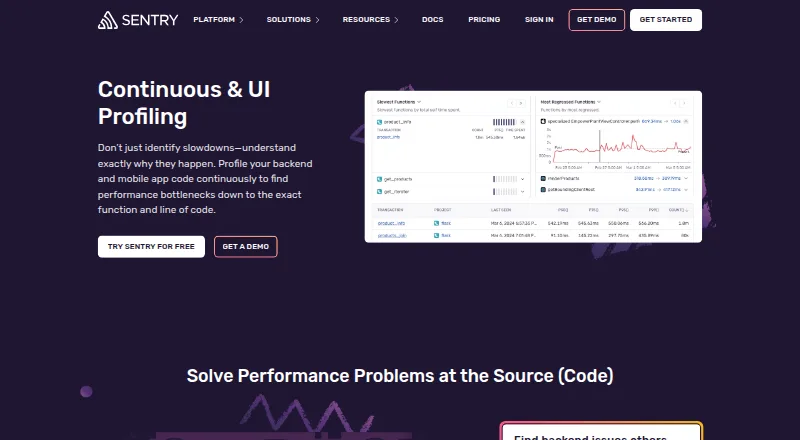
What Sentry Continuous Profiling is
Sentry Continuous Profiling helps teams locate backend performance bottlenecks down to functions and lines of code, with a focus on Node.js and Python. Continuous profiles can run for arbitrarily long durations. An Aggregate Flamegraph summarizes project performance without requiring a single transaction as its scope. Developers can control profiling with startProfiler and stopProfiler APIs, or configure a trace lifecycle that starts profiling when a root span is active. UI Profiling covers iOS, macOS, and Android, while browser JavaScript and Electron are also listed. Sentry says profiling requires performance monitoring to be enabled in the app. Continuous and UI Profiling are charged by their respective profile-hour measures and are available through pay-as-you-go usage. Sentry lists a free plan and paid pricing from $26/mo. Integrations include GitHub, Jira, Slack, GitLab, Linear, Microsoft Teams, and PagerDuty; the GitHub integration can associate commits with releases and report unhandled issues in pull requests.
Good
- Profiles can run without a 30-second limit.
- Aggregate Flamegraph summarizes an entire project.
- Manual and trace-lifecycle profiling controls are available.
- UI profiling covers iOS, macOS, and Android.
- Free plan is available.
Watch out
- Profiling requires performance monitoring to be enabled.
- Continuous and UI profiling are billed by profile hours.
- Continuous profiling availability depends on the SDK.
- Browser profiling is listed for specified JavaScript frameworks.
Who it suits
It suits development teams investigating backend slowdowns in Node.js or Python and teams improving frontend or mobile responsiveness. Organizations already using performance monitoring may find the profiling controls and integrations relevant.
Verdict
Sentry Continuous Profiling offers long-running backend profiles alongside mobile and browser UI profiling. Check SDK availability and profile-hour billing for the runtimes you need.
The facts
Each one read from Sentry Continuous Profiling's own pages, with the date it was checked.
What it does
- Aggregate flamegraph
- An Aggregate Flamegraph view summarizes performance across an entire project without requiring a single transaction as the scope.checked 30 Sep 2026
- Backend profiling
- Continuous Profiling supports Node.js and Python and can profile code for unlimited durations.checked 29 Sep 2026
- Enterprise support
- Sentry says enterprise customers can get a dedicated support team for product questions, onboarding help, and feedback.checked 30 Sep 2026
- Flamegraphs
- An Aggregate Flamegraph shows performance across a project without requiring a single transaction scope.checked 29 Sep 2026
- Frontend and mobile runtimes
- The changelog lists UI Profiling for iOS/macOS and Android, while a later changelog adds Browser JavaScript and Electron support.checked 30 Sep 2026
- Hosting
- Sentry says it is hosted on Google Cloud Platform using a multi-tenant architecture.checked 30 Sep 2026
- Integration example
- Sentry's GitHub integration links commits to releases, reports unhandled issues in pull requests, and can route issue assignments using a CODEOWNERS file.checked 30 Sep 2026
- Integration options
- Sentry lists integrations including GitHub, Jira, Slack, GitLab, Linear, Microsoft Teams, and PagerDuty.checked 29 Sep 2026
- Mobile profiling
- UI Profiling supports iOS, macOS, and Android.checked 29 Sep 2026
- Product focus
- Sentry Continuous Profiling helps teams find backend performance bottlenecks and infrastructure costs in Node.js and Python code.checked 30 Sep 2026
- Product scope
- Sentry describes profiling as a way to find performance bottlenecks down to the function and line of code.checked 29 Sep 2026
- Profile duration
- Continuous profiles can run for arbitrarily long durations, with no 30-second limit.checked 30 Sep 2026
- Profiler controls
- The startProfiler and stopProfiler APIs let developers control when profiling runs, and profileLifecycle can select manual or trace-triggered behavior.checked 30 Sep 2026
- Profiling setup
- Sentry says profiling requires performance monitoring to be enabled in the app.checked 29 Sep 2026
- Sampling
- The profileSessionSampleRate option provides session-scoped sampling.checked 30 Sep 2026
- Security certifications
- Sentry's Trust Center says its SOC 2 Type 2 report and ISO 27001 certificate are available through an account or by contacting Sentry.checked 30 Sep 2026
- Support for profiling
- Sentry's profiling support article applies to SaaS customers and says continuous profiling availability depends on the SDK.checked 29 Sep 2026
- Trace lifecycle
- The profileLifecycle option supports manual profiling or a trace lifecycle that starts profiling when a root span is active.checked 29 Sep 2026
Money
- Billing unit
- Sentry says profiling is billed by Continuous Profile Hours and UI Profile Hours.checked 30 Sep 2026
- Free plan
- Sentry says its Developer plan remains free.checked 29 Sep 2026
- Plan access
- Sentry's 2025 plan update says UI and Continuous Profiling are available through pay-as-you-go usage.checked 29 Sep 2026
Where it runs
- Browser profiling detail
- Browser JavaScript UI Profiling is listed for Angular, Ember, React, Solid, Svelte, and Vue SDKs.checked 30 Sep 2026
- Platform coverage
- Sentry lists SDK platforms including Android, iOS, macOS, JavaScript, Node, Python, PHP, and many other languages and frameworks.checked 29 Sep 2026
The company
- Company founding and headquarters
- Inc. lists Sentry as founded in 2012 and located in San Francisco, California.checked 30 Sep 2026
The full review of Sentry Continuous Profiling
Sentry Continuous Profiling is a performance-monitoring tool for finding backend and interface slowdowns at code level. It suits teams working across Node.js or Python services and mobile or browser apps. Its strongest case is pairing long-running backend profiles with UI profiling; runtime support and usage-based billing need checking against the workloads you plan to profile.
Overview
Sentry connects profiling to its broader performance monitoring: that monitoring must be enabled in the app before profiling can work. Backend profiling targets Node.js and Python, while UI Profiling covers mobile and browser experiences. Continuous profiles can run without a 30-second cutoff, which gives teams investigating intermittent or prolonged backend work more room to observe behavior.
The service is hosted on Google Cloud Platform with a multi-tenant architecture. Sentry states that it holds SOC 2 Type 2 and ISO 27001 certifications and a HIPAA attestation. Its profiling support applies to SaaS customers, and continuous profiling availability depends on the SDK in use.
Compare it with Continuous Profiling Tools, Error Monitoring Software, or Mobile App Monitoring to see the broader categories it serves.
Key features
Backend and interface profiling
Continuous Profiling is aimed at locating backend bottlenecks and infrastructure costs in Node.js and Python code. UI Profiling extends the picture to iOS, macOS, and Android, as well as browser JavaScript and Electron. Browser coverage includes Angular, Ember, React, Solid, Svelte, and Vue SDKs. This makes Sentry a broader fit for teams responsible for both services and client experiences, though profiling support still varies by SDK.
Capture controls and project-wide analysis
The SDK provides startProfiler and stopProfiler for manual capture. The profileLifecycle option can instead tie profiling to a trace, starting when a root span is active. Session-scoped sampling through profileSessionSampleRate gives teams another way to control which sessions contribute profiles.
Aggregate Flamegraphs summarize performance across a project without requiring one transaction to define the scope. That is useful when the question is whether a pattern recurs across the project, rather than what happened in a single traced request.
Connected workflow
Sentry integrates with GitHub, Jira, Slack, GitLab, Linear, Microsoft Teams, and PagerDuty. Its GitHub integration can connect commits to releases, surface unhandled issues in pull requests, and route issue assignments using a CODEOWNERS file. Release tracking, source-map support, frontend monitoring, and session replay complement the profiling workflow.
Pricing
Sentry uses a freemium model, with a free plan and paid plans from $26/mo. The free plan includes a cap of 5,000 events per month, making it a bounded starting point rather than an unlimited production allowance.
Continuous and UI Profiling are offered through pay-as-you-go usage and billed by Continuous Profile Hours and UI Profile Hours, respectively. That separates profiling charges from the base plan price: teams should account for profile hours as well as the plan when estimating ongoing cost. The $26/mo entry point may suit teams needing paid Sentry capabilities, but profiling usage is an additional factor to budget for.
Enterprise customers can receive a dedicated support team for product questions, onboarding, and feedback. No separate enterprise price is given; expect custom pricing.
Platforms
Sentry lists Android, iOS, macOS, JavaScript, Node, Python, PHP, and many other language and framework SDKs. Its platform coverage also spans API, browser, Linux, Windows, extensions, and self-hosted environments. Profiling is narrower than that overall platform footprint: continuous profiling availability depends on SDK, and the named backend runtimes are Node.js and Python. The product is deployed in the cloud, with self-hosted also included in its platform coverage.
Who it's for
Sentry is a strong fit for engineering teams that want backend profiling and mobile or browser UI profiling alongside performance monitoring, releases, and issue workflows. Node.js and Python teams get the clearest backend case; teams shipping iOS, macOS, Android, or supported browser frameworks can add interface profiling. It is a weaker fit for teams whose key runtime is outside the named profiling coverage or those who need predictable profiling costs without metering by profile hours.
Pros and cons
- Pro: Backend profiles have no fixed 30-second limit, which suits investigation of long-running behavior.
- Pro: Aggregate Flamegraphs reveal project-wide patterns without requiring a single transaction as the scope.
- Pro: Manual controls, trace-linked lifecycle capture, and session sampling let teams shape when profiling runs.
- Pro: UI Profiling spans mobile and supported browser runtimes, extending profiling beyond backend services.
- Con: Profiling depends on performance monitoring being enabled and on SDK-specific availability, adding setup and runtime constraints.
- Con: Profile-hour billing means the entry plan price alone does not determine profiling cost.
- Con: The free plan's 5,000 monthly event quota places a clear ceiling on free usage.
Alternatives
Consider Backtrace if a free plan and broad coverage across mobile, desktop, and game-console environments matter; its Developer plan includes one developer, up to 25,000 monthly errors, one-month retention, and 10 GB storage.
BugSnag is another freemium option, with a free plan for one user, 7.5K events and 1M spans per month, plus coverage for 50+ platforms and 30+ integrations. Choose it when those stated free-tier allowances better match your monitoring needs.
Airbrake may suit a small team seeking a defined annual-billed entry point: its Dev + errors plan costs $17 a month, billed annually, for 25,000 errors, one user, and one team.
Rollbar is an alternative with a freemium model and a monthly Essentials plan whose stated ranges cover 10K–50M occurrences, 1K–10M replays, and 4K–10M credits per month, with up to 90 days of retention.
Firebase Cloud Messaging is a no-cost choice for readers specifically seeking cloud messaging rather than profiling.
GlitchTip is another freemium alternative, with web, API, and self-hosted platforms.
elmah.io is a paid alternative with a Small Business plan at $26 a month, billed monthly, for three users, unlimited applications, and 10,000 messages per month.
Embrace User Session Insights is a freemium option for web, iOS, and Android.
For game-focused crash reporting, see Game Crash Reporting Software.
Verdict
Choose Sentry Continuous Profiling if your team needs long-running Node.js or Python backend profiles alongside UI profiling and already benefits from Sentry's performance-monitoring workflow. Its flexible capture controls and project-wide flamegraphs are meaningful strengths. Look elsewhere if your profiling runtime is not supported or if profile-hour billing makes costs harder to forecast.
Alternatives to Sentry Continuous Profiling
- 1
Grafana Cloud Application Observability
Free planAndroidiOSWebAPI8.4From $0.03 a month - 2
Coroot
Free planOpen sourceWebAPILinuxSelf-hosted8.2From $1 a month - 3

Middleware
Free planAndroidiOSWebAPI8.2$0.30 usage-based - 4
Alibaba Cloud ARMS RUM
AndroidiOSWebAPI7.5$0.02 usage-based - 5
Metoro Kubernetes Profiling
Free planWebAPILinuxSelf-hosted7.5From $20 a month - 6

OneUptime
Free planWebAPILinuxSelf-hosted7.0From $0.10 a month