Grafana Cloud Application Observability
Grafana Cloud Application Observability is a cloud application monitoring product that uses OpenTelemetry and Prometheus data to help software engineers inve…
What Grafana Cloud Application Observability is
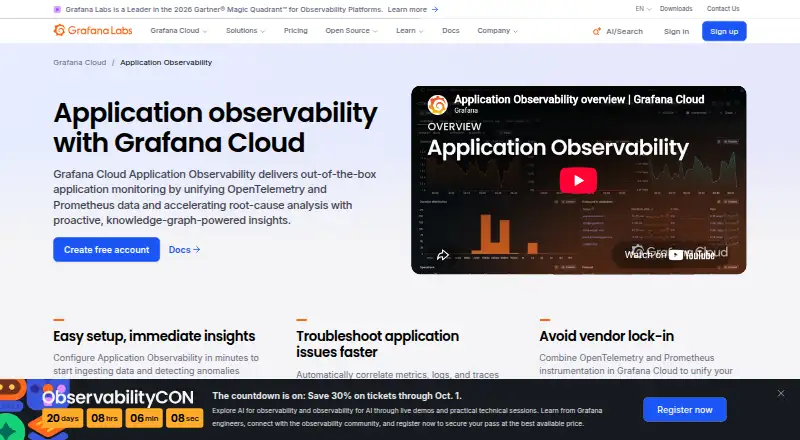
Grafana Cloud Application Observability is a cloud application monitoring product that uses OpenTelemetry and Prometheus data to help software engineers investigate problems. Its knowledge graph discovers services and their relationships from telemetry, while the service catalog shows latency, error ratio, and request rate for each service. The RCA workbench and Entity Graph help examine related issues across a stack. Metrics, logs, traces, and profiles appear in one view, with the option to drill from a service into its signals. Grafana identifies Alloy as a collector with native pipelines for OpenTelemetry and Prometheus. The free plan includes up to 2,232 host hours per month and community support. Paid usage is charged for host hours and application telemetry at standard Grafana Cloud rates; serverless use is billed on ingested telemetry instead of host hours. Free is free, and Pro is $0.03 a month, with a $19 monthly platform fee and $0.025 per host hour listed. Supported platforms are Linux, macOS, Windows, and web.
Good
- Discovers services and relationships from telemetry.
- Shows latency, error ratio, and request rate.
- Combines metrics, logs, traces, and profiles.
- Includes distributed tracing and dependency mapping.
Watch out
- Free use is limited to 2,232 host hours monthly.
- Free plan includes community support.
- Paid usage charges for host hours and telemetry.
- Serverless use is billed on ingested telemetry.
Who it suits
It suits software engineers who need to detect anomalies, investigate causes, and address application problems. Teams using OpenTelemetry or Prometheus can use its listed compatibility and Alloy pipelines.
Verdict
Grafana Cloud Application Observability brings service discovery, health signals, and root-cause investigation into one cloud product. Check its host-hour and telemetry billing details against your deployment, especially for serverless environments.
Plans and prices
From Grafana Cloud Application Observability's own pricing page, checked 14 Oct 2026.
| Plan | Price | What it gives you |
|---|---|---|
| Free | Free | 2,232 host hours/month · community support · no credit card · Always free |
| Pro | $0.03 a month | 50 GB ingested/month included · 30-day retention · 8×5 email support · automatic volume discounts · $0.025/host hour ($18/host); $19/month platform fee |
| Enterprise | Priced on request | Premium support · public, federal, or bring-your-own-cloud deployment · Custom pricing; minimum $25,000 annual commit |
The facts
Each one read from Grafana Cloud Application Observability's own pages, with the date it was checked.
What it does
- Automatic anomaly detection
- Automatic baselines and knowledge-graph analysis detect saturation, anomalies, failures, and errors without custom queries or alert rules.checked 14 Oct 2026
- Beyla requirement
- Grafana Beyla auto-instrumentation works without code changes but requires Linux kernel 5.8 or newer with BTF enabled.checked 14 Oct 2026
- Developer tooling
- Developer resources include Grafana CLI, Foundation SDK, observability-as-code, Git Sync, and CI/CD dashboard provisioning.checked 14 Oct 2026
- Documentation depth
- The documentation covers setup, instrumentation, pricing, cost optimization, troubleshooting, APIs, SDKs, dashboards, integrations, and signal exploration.checked 14 Oct 2026
- Instrumentation options
- Supported approaches include Grafana Java and .NET distributions, upstream JavaScript/Python/PHP/Go SDKs, Beyla eBPF, and the OpenTelemetry Operator.checked 14 Oct 2026
- Integrations
- Grafana Cloud connection tiles support Java, .NET, Beyla, Grafana Alloy, OTLP, and the upstream OpenTelemetry Collector.checked 14 Oct 2026
- License
- The Grafana open-source project is distributed under AGPL-3.0-only, with listed Apache-2.0 exceptions; Grafana Cloud itself is a managed service.checked 14 Oct 2026
- Limit: AWS Marketplace reviewers
- Reviewers report configuration complexity, steep expertise requirements, non-real-time alerting at times, and maintenance overhead from extensive customization.checked 14 Oct 2026
- Limit: G2 learning curve
- G2 reviewers repeatedly report steep learning curves, complex setup, and difficult query configuration.checked 14 Oct 2026
- Limit: Gartner pricing
- Gartner’s displayed dislikes repeatedly identify cost as a problem.checked 14 Oct 2026
- Limit: TrustRadius alerting
- TrustRadius reviewers mention limited baseline or anomaly alerting, insufficient data transformation, and complexity for advanced setups.checked 14 Oct 2026
- OpenTelemetry compatibility
- Applications can send OTLP telemetry using Grafana or upstream OpenTelemetry SDKs and collectors.checked 14 Oct 2026
- Praise: AWS Marketplace reviewers
- Reviewers praise unified dashboards, broad data-source integrations, customization, and alerting.checked 14 Oct 2026
- Praise: G2 dashboards
- G2 reviewers repeatedly praise flexible, intuitive dashboards and real-time visualization.checked 14 Oct 2026
Money
- Billing
- Application Observability charges for host hours and for application telemetry at standard Grafana Cloud rates.checked 29 Sep 2026
- Free plan
- Yeschecked 23 Sep 2026
- Free usage limit
- The free Application Observability plan includes up to 2,232 host hours per month and community support.checked 29 Sep 2026
- Limit: billing identity
- Services missing supported OpenTelemetry host identifiers are excluded from host-hour billing and receive a configuration warning.checked 14 Oct 2026
The company
- Company
- Grafana Labs lists its headquarters as New York, New York, USA, and its founding year as 2014.checked 29 Sep 2026
- Company founded
- Grafana Labs was founded in 2014 by Raj Dutt, Anthony Woods, and Torkel Ödegaard.checked 14 Oct 2026
- Company legal name
- Crunchbase lists Grafana Labs’ legal name as Raintank, Inc.checked 14 Oct 2026
- Founded
- 2014checked 28 Sep 2026
Where it runs
- Limit: Android app scope
- The official Android app requires a Grafana Cloud account and does not support Grafana OSS.checked 14 Oct 2026
- Limit: iOS alert sounds
- An App Store reviewer requested custom alert ringtones because built-in sounds were not loud enough for on-call use.checked 14 Oct 2026
The full review of Grafana Cloud Application Observability
Overview
Grafana Cloud Application Observability is a cloud application monitoring service built around OpenTelemetry and Prometheus data. It is best suited to software engineers investigating application performance across services; its unified signals and service map are useful, but host-hour and telemetry charges deserve close attention.
The service connects metrics, logs, traces, and profiles in a shared view, letting engineers move from a service to its signals during an investigation. That is a practical advantage for teams that need to follow problems across an application stack, rather than work with each telemetry type separately.
Key features
Service discovery and health
A knowledge graph discovers services and their relationships from telemetry, while the service catalog shows latency, error ratio, and request rate for each service. Together, these give engineers a way to spot which service is unhealthy and see how it relates to the rest of the application.
Root-cause investigation
The RCA workbench and Entity Graph support investigation of correlated issues across a stack. Distributed and transaction tracing, dependency mapping, and log correlation extend that investigative picture. These tools are most relevant to teams with multi-service applications; a smaller, simpler deployment may not need the full breadth.
Telemetry and alerting
Metrics, logs, traces, and profiles share a view, with drill-down from a service into its signals. Alert deduplication, routing, enrichment, and suppression rules can help teams manage alerts alongside application investigation. OpenTelemetry and Prometheus are supported, and Grafana identifies Alloy as a collector with native pipelines for both.
Pricing
The pricing model is freemium. The Free plan costs nothing and is always free, with up to 2,232 host hours per month and community support. It is a sensible starting point for evaluation or modest usage, but teams needing more capacity should account for paid usage.
Pro is priced at $0.03 a month, billed at $0.025 per host hour, with a $19 monthly platform fee that includes 2,232 host hours. Usage above that allowance is pay as you go. The included hours make the platform fee meaningful even before extra usage; compare expected host hours and telemetry volume before choosing it.
Enterprise has custom pricing and includes full service, premium support, and deployment flexibility. It is the option for organizations that need those service and deployment provisions rather than a published entry-level rate.
Application Observability charges for host hours and application telemetry at standard Grafana Cloud rates. For serverless environments, billing is based on ingested telemetry rather than host hours, so the cost basis differs by deployment type.
Platforms
Grafana Cloud Application Observability is a cloud deployment available for Linux, macOS, web, and Windows. Its cloud model suits teams seeking hosted monitoring rather than a self-hosted deployment.
Who it's for
Grafana positions the product for software engineers who need to detect anomalies, identify root causes, and fix application problems. It is a strong fit when teams already work with OpenTelemetry or Prometheus and need service-level health signals plus investigation across telemetry types. It is less compelling for buyers whose main need is a self-hosted monitoring stack or whose usage makes host-hour and telemetry billing difficult to forecast.
Pros and cons
- Pros: Service discovery and RED metrics connect service relationships with practical health indicators.
- Pros: Metrics, logs, traces, and profiles can be followed from a service view, supporting investigations across signals.
- Pros: OpenTelemetry and Prometheus compatibility suits teams using those telemetry formats.
- Cons: Pro combines a monthly platform fee with host-hour charges and additional pay-as-you-go usage, requiring cost monitoring.
- Cons: Serverless billing is based on ingested telemetry, so the usual host-hour basis does not apply.
- Cons: The free allowance is capped at 2,232 host hours per month and includes community support.
Alternatives
Elastic Observability is worth considering for buyers seeking a paid observability product with a free plan and trial, or platforms including self-hosted deployment; its serverless complete plan uses usage-based pricing, with logs and traces ingest starting at $0.09/.
Wazuh may suit teams seeking a free and open-source self-hosted option, with a paid Small plan starting at $571 a month.
Zabbix is another freemium option with self-hosted support; its Silver plan shows € 245 /month billed annually, with no USD price shown.
TrueWatch Log Management offers a freemium alternative with a free plan for individual developers and small teams, subject to usage quotas.
For alert and incident workflows, AlertOps has a free plan capped at five users, while PagerDuty offers a free incident-management plan with five users, one on-call schedule, and one escalation policy. xMatters also has a free tier capped at five users and a Starter plan priced at $15 a month.
Prometheus is a free, open-source monitoring and alerting toolkit for teams that want a self-hosted option rather than Grafana's cloud application observability service.
Readers focused on adjacent categories can also browse Alert Management Software, Profiling Software, Cloud Monitoring, Incident Management Software, Distributed Tracing Tools, and Database Performance Monitoring Software.
Verdict
Choose Grafana Cloud Application Observability if your engineering team needs service discovery, RED health metrics, and cross-signal root-cause investigation in a cloud product, especially with OpenTelemetry or Prometheus data. Look elsewhere if self-hosting is essential or if host-hour and telemetry-based costs do not suit your deployment.
Getting started
- Visit https://grafana.com/products/cloud/application-observability/.
- Select the Free plan or Pro plan based on the listed usage and billing details.
- Send OpenTelemetry or Prometheus data; Grafana identifies Alloy as a collector with native pipelines for both.
- Use the service catalog to view service health metrics, then investigate correlated issues in the RCA workbench or Entity Graph.
Limits worth knowing
The Free plan includes up to 2,232 host hours per month and community support. Pro includes 2,232 host hours with its $19 monthly platform fee; host hours and application telemetry are charged at Grafana Cloud rates, while serverless usage is billed on ingested telemetry.
Questions
Is Grafana Cloud Application Observability free?
Yes. Its Free plan is listed as free and includes up to 2,232 host hours per month with community support.
How much does Pro cost?
Pro is listed at $0.03 a month. Its billing details specify a $19 monthly platform fee and $0.025 per host hour, with 2,232 host hours included with the platform fee.
Which telemetry formats does it support?
Grafana says Application Observability is compatible with OpenTelemetry and Prometheus. Alloy is identified as a collector with native pipelines for both.
How is serverless usage billed?
For serverless environments, usage is billed based on telemetry ingested rather than host hours.
Which platforms are listed?
The listed platforms are Linux, macOS, Windows, and web.
What compliance credentials are listed?
The product page lists FedRAMP compliance, NATSEC100 certification, PCI DSS compliance, A-LIGN certification, AICPA SOC Type II verification, and GDPR compliance.
Alternatives to Grafana Cloud Application Observability
- 1
Grafana Loki
Free planOpen sourceWebAPILinuxSelf-hosted8.9From $19 a month - 2
Logflare
Open sourceAndroidiOSWebAPI8.9$10 usage-based - 3
Google Cloud Logging
Free planiOSWebAPILinux8.8From $0.01 a month - 4
ClickStack
Free planOpen sourceWebAPILinuxSelf-hosted8.6From $53 a month - 5
HyperDX
Free planOpen sourceWebAPILinuxSelf-hosted8.5From $20 a month - 6
syslog-ng
Free planOpen sourceAPILinuxmacOSSelf-hosted8.5$2,800 one-time