Grafana Loki
Grafana Loki is a log aggregation system for storing and querying logs from applications and infrastructure.
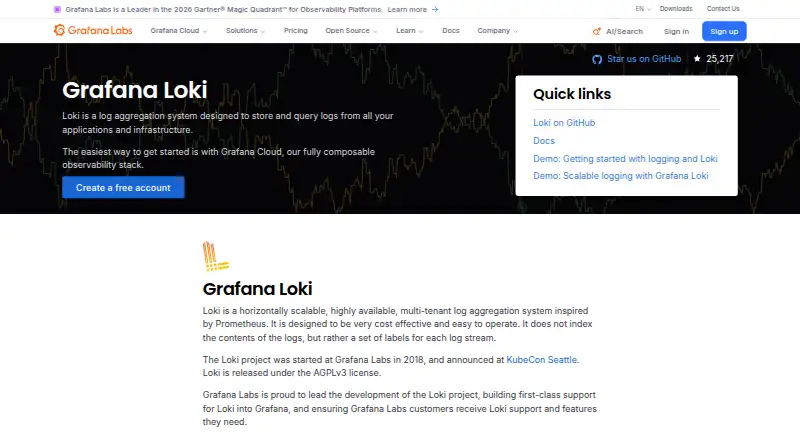
What Grafana Loki is
Grafana Loki is a log aggregation system for storing and querying logs from applications and infrastructure. It can be self-hosted or used through Grafana Cloud Logs plans. Loki is horizontally scalable, highly available, and multi-tenant; it indexes labels rather than the contents of log lines. LogQL lets users explore logs in Grafana or with the LogCLI command-line tool. Grafana says Loki stores logs in object storage for high throughput, durable storage, and petabyte-scale use. It can evaluate alerting rules on incoming logs and send alerts to Prometheus Alertmanager. Native integrations include Prometheus, Grafana, and Kubernetes, while documented log shippers include Grafana Alloy, OpenTelemetry, Docker, Fluent Bit, Fluentd, and Logstash. Installation options include Helm, Tanka, Docker or Docker Compose, local installation, and source builds. Loki is released under AGPLv3. It has no authentication layer, so Grafana instructs users to put an authenticating reverse proxy in front of its services. Grafana also warns that high-cardinality labels can reduce performance and cost-effectiveness.
Good
- Supports horizontal scaling, high availability, and multiple tenants.
- Query logs with LogQL in Grafana or LogCLI.
- Can send log-based alerts to Prometheus Alertmanager.
- Integrates natively with Prometheus, Grafana, and Kubernetes.
- Available as AGPLv3-licensed self-hosted software.
Watch out
- No built-in authentication layer.
- High-cardinality labels can reduce performance and cost-effectiveness.
- Cloud Pro charges a platform fee plus usage.
Who it suits
Loki suits teams that need to aggregate and query application or infrastructure logs and can manage a self-hosted deployment or use Grafana Cloud Logs. Its label-based indexing and LogQL are central considerations for selecting it.
Verdict
Loki offers log storage, querying, and alerting with several deployment and ingestion options. Plan for a separate authentication layer and take care with label cardinality.
Plans and prices
From Grafana Loki's own pricing page, checked 15 Oct 2026.
| Plan | Price | What it gives you |
|---|---|---|
| Grafana Cloud Logs Free | Free | 50 GB ingested/month · 14-day retention · community support · always free |
| Grafana Loki OSS self-hosted | Free | self-administered installation · free open-source software |
| Loki (self-hosted) | Free | No price stated on the Loki product page · AGPLv3 open-source project; self-managed |
| Grafana Cloud Logs Pro | $19 a month | 50 GB included then usage billing · 30-day retention · 8×5 email support · $0.050/GB process · $0.400/GB write · $0.100/GB retain · $19/month + usage |
| Grafana Cloud Logs Enterprise | — | custom retention · premium support · public cloud, federal cloud or bring-your-own-cloud deployment · minimum $25,000/year spend commit |
The facts
Each one read from Grafana Loki's own pages, with the date it was checked.
What it does
- Alerting
- The Loki ruler evaluates log queries continuously and integrates with Prometheus Alertmanager or Grafana alerting.checked 15 Oct 2026
- Architecture
- Loki is horizontally scalable, highly available, and multi-tenant, and it indexes labels rather than the contents of log lines.checked 11 Oct 2026
- Authentication limit
- Loki does not include an authentication layer, so Grafana instructs users to put an authenticating reverse proxy in front of its services.checked 11 Oct 2026
- Authentication limitation
- Loki ships without an authentication layer, so operators must place an authenticating reverse proxy in front of it.checked 15 Oct 2026
- Compressed storage
- Log contents are compressed into chunks stored in object storage such as Amazon S3, Google Cloud Storage, Azure Blob Storage or a local filesystem.checked 15 Oct 2026
- Deployment options
- self-hostedchecked 24 Sep 2026
- Documentation depth
- The documentation covers architecture, deployment modes, configuration, ingestion clients, operations, multi-tenancy, LogQL, APIs, troubleshooting, upgrades and release notes.checked 15 Oct 2026
- Grafana integration
- Grafana has built-in Loki support, so a separate data-source plugin is not required.checked 15 Oct 2026
- HTTP API
- The public HTTP API supports log push, OTLP ingestion, instant and range queries, tailing, labels, rules, deletion and cluster status endpoints.checked 15 Oct 2026
- Independent assessment
- Thoughtworks’ 2025 Technology Radar says Loki reduces operational complexity and storage costs, integrates tightly with Grafana and Alloy, and added native OpenTelemetry support in version 3.0.checked 15 Oct 2026
- Installation
- Grafana documents installation using Helm, Tanka, Docker or Docker Compose, local installation, and source builds.checked 11 Oct 2026
- Integrations
- Official documentation lists Grafana Alloy as the recommended collector and describes OpenTelemetry, Promtail, Fluent Bit, Fluentd, Vector, Logstash and other clients.checked 15 Oct 2026
- Label-based indexing
- Loki indexes stream labels and metadata instead of indexing the full text of each log line.checked 15 Oct 2026
- Label cardinality
- Grafana warns that high-cardinality labels can significantly reduce Loki performance and cost-effectiveness.checked 11 Oct 2026
- License
- Grafana states that Loki is released under the GNU Affero General Public License version 3.checked 15 Oct 2026
- License and project history
- Loki is released under AGPLv3, and Grafana says the project started at Grafana Labs in 2018.checked 11 Oct 2026
- Limit: full-text search
- Independent analysis says ad-hoc full-text searches over large time ranges can be slower than Elasticsearch or Splunk because Loki filters labels before scanning log contents.checked 15 Oct 2026
- Limit: label discipline
- Reviewers warn that high-cardinality or poorly chosen labels can cause slow queries, large scans and production performance problems.checked 15 Oct 2026
- Limit: learning curve
- TrustRadius reviewers report a steep learning curve, difficulty with long-term log insight and a need for better query suggestions and syntax checking.checked 15 Oct 2026
- Limit: operational complexity
- Independent review coverage says production deployments commonly involve six or more independently scaling components and require Kubernetes expertise.checked 15 Oct 2026
- Limit: reporting and forensics
- Independent guidance says Loki is weak for immutable audit trails, scheduled reports, PDF or spreadsheet exports, broad forensic searches and compliance-heavy reporting.checked 15 Oct 2026
- Live log tailing
- Yeschecked 24 Sep 2026
- Log pipelines
- Yeschecked 24 Sep 2026
Money
- Free plan
- Yeschecked 24 Sep 2026
Alternatives to Grafana Loki
- 1
Grafana Cloud Application Observability
Free planAndroidiOSWebAPI8.9From $0.03 a month - 2
Logflare
Open sourceAndroidiOSWebAPI8.9$10 usage-based - 3

Google Cloud Logging
Free planiOSWebAPILinux8.8From $0.01 a month - 4

ClickStack
Free planOpen sourceWebAPILinuxSelf-hosted8.6From $53 a month - 5
HyperDX
Free planOpen sourceWebAPILinuxSelf-hosted8.5From $20 a month - 6
syslog-ng
Free planOpen sourceAPILinuxmacOSSelf-hosted8.5$2,800 one-time