
Elastic Observability
Elastic Observability brings logs, metrics, application traces, user experience data, and other telemetry together for application and infrastructure monitor…
What Elastic Observability is
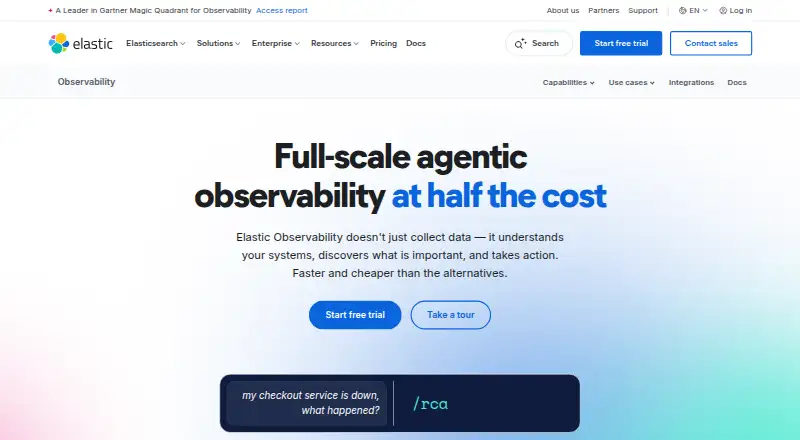
Elastic Observability brings logs, metrics, application traces, user experience data, and other telemetry together for application and infrastructure monitoring. It supports log analysis with ES|QL, application performance and infrastructure monitoring, incident investigation, alerting, cases, and service level objectives. Its listed capabilities also include anomaly detection, an AI Assistant, AI-powered log parsing, LLM observability, and CPU profiling through stack sampling. The platform supports OpenTelemetry and vendor-neutral instrumentation, including native data collection without proprietary agents. Deployment choices include Serverless, Hosted, and self-managed, with self-managed installations able to run on customer infrastructure. Serverless pricing is usage-based and varies by telemetry and project tier; pricing is also available on request. A 14-day trial and a free plan are listed. For Serverless Complete, logs and traces ingest starts at $0.09/GB and metrics ingest at $0.023/GB; retention starts at $0.019/GB/month for logs and traces and $0.005/GB/month for metrics. Serverless Logs Essentials ingest starts at $0.07/GB, with retention starting at $0.017/GB/month.
Good
- Combines logs, metrics, traces, and user experience data.
- Supports OpenTelemetry without proprietary agents.
- Offers Serverless, Hosted, and self-managed deployment options.
- Includes alerting, cases, and service level objectives.
- A 14-day trial is listed.
Watch out
- Serverless pricing varies by usage and project tier.
- Mobile app monitoring is listed as unavailable.
- Serverless support levels vary by subscription.
Who it suits
It suits teams that need to analyze application and infrastructure telemetry, investigate incidents, or monitor performance across deployment types. OpenTelemetry support may suit teams seeking vendor-neutral instrumentation.
Verdict
Elastic Observability covers telemetry analysis, monitoring, and incident response with managed and self-managed deployment choices. Pricing depends on usage, and mobile app monitoring is not listed as available.
Plans and prices
From Elastic Observability's own pricing page, checked 29 Sep 2026.
| Plan | Price | What it gives you |
|---|---|---|
| Observability Serverless Complete | — | Full-stack logs, metrics, traces, and synthetic test analysis · SLOs · AI-assisted pipelines and parsing · Machine learning · Agentic AI and scripted workflows · Private connectivity and IP filtering · Usage-based: logs and traces ingest starts at $0.09/GB; metrics ingest starts at $0.023/GB; logs and traces retention is $0.019/GB/month; metrics retention is $0.005/GB/month; egress is 50 GB free, then $0.05/GB transferred per month. |
| Observability Serverless Logs Essentials | — | Ad hoc log analysis · Built-in and custom dashboards · Integrations · Alerts and notifications · Usage-based: ingest starts at $0.07/GB; retention starts at $0.017/GB/month; egress is 50 GB free, then $0.05/GB transferred per month. |
The facts
Each one read from Elastic Observability's own pages, with the date it was checked.
What it does
- AI and profiling
- Elastic documents zero-configuration anomaly detection, an AI Assistant, AI-powered log parsing with Streams, LLM observability, and Universal Profiling.checked 29 Sep 2026
- Archive export
- Yeschecked 24 Sep 2026
- Deployment
- Elastic lists Serverless, Hosted, and self-managed deployment options for Observability; Serverless is fully managed, while self-managed deployments can run on customer infrastructure.checked 29 Sep 2026
- Deployment options
- bothchecked 24 Sep 2026
- Integrations
- Elastic says its Serverless offering includes over 350 integrations, and its infrastructure monitoring overview lists more than 400 out-of-the-box integrations.checked 29 Sep 2026
- Live log tailing
- Yeschecked 24 Sep 2026
- Log pipelines
- Yeschecked 24 Sep 2026
- OpenTelemetry
- Elastic Observability supports OpenTelemetry and vendor-neutral instrumentation, including native OpenTelemetry data collection without proprietary agents.checked 29 Sep 2026
- Pricing basis
- Observability Serverless pricing is based on usage, including data ingested and retained, and the listed rates vary by telemetry and project tier.checked 29 Sep 2026
- Purpose
- Elastic Observability unifies application and infrastructure monitoring by bringing logs, metrics, application traces, user experience data, and other telemetry together for analysis.checked 29 Sep 2026
- Security and access
- The Observability Serverless Complete tier includes private connectivity and IP filtering.checked 29 Sep 2026
- Service availability
- Elastic states that Elastic Cloud Serverless has a 99.95% monthly uptime service level agreement.checked 29 Sep 2026
- Structured log parsing
- Yeschecked 24 Sep 2026
- Support
- For Serverless, limited support is included with a Standard subscription; the listed Gold, Platinum, and Enterprise support charges are 5%, 10%, and 15% of consumption.checked 29 Sep 2026
- Troubleshooting
- The platform supports log analysis with ES|QL, application performance monitoring, infrastructure monitoring, incident investigation, alerting, cases, and service level objectives.checked 29 Sep 2026
The company
- Founded
- 2012checked 28 Sep 2026
- Headquarters
- Amsterdam, Netherlands and Mountain View, California, United Stateschecked 28 Sep 2026
Money
- Free trial
- The Observability documentation advertises a 14-day free trial with all features included and no setup required.checked 29 Sep 2026
The full review of Elastic Observability
Overview
Elastic Observability is a broad telemetry platform for engineering and operations teams that need to investigate application and infrastructure behavior together. Its strongest case is the combination of logs, metrics, traces, user experience monitoring and incident-response tools, with a choice between managed and self-managed deployment.
That breadth makes it a better fit for teams consolidating observability workflows than for buyers seeking a simple, fixed-price tracing tool.
Key features
Logs, traces and investigation
Logs can be piped, parsed as structured data, tailed live and exported to an archive. ES|QL supports log analysis, while distributed and transaction tracing, dependency mapping, log correlation and error correlation help connect symptoms across services. This is a substantial toolkit for incident investigation, but it also means the platform is aimed at teams with varied telemetry needs rather than a narrow logging-only use.
Application performance and infrastructure monitoring sit alongside alerting, cases and service level objectives. Real user monitoring adds interaction tracking, geographic breakdowns and Core Web Vitals; browser checks provide another way to monitor service behavior. Mobile app monitoring is not part of the described capability set, so teams focused on mobile app telemetry should look elsewhere.
Open instrumentation, AI and profiling
OpenTelemetry support, including native collection without proprietary agents, gives teams a vendor-neutral instrumentation path. Elastic also documents zero-configuration anomaly detection, an AI Assistant, AI-powered log parsing through Streams, LLM observability and Universal Profiling. CPU profiling uses stack sampling. These options extend the platform beyond basic dashboards, though the breadth will matter most to teams prepared to make use of multiple analysis and troubleshooting tools.
Elastic describes more than 400 out-of-the-box integrations in its infrastructure monitoring overview and over 350 integrations for Serverless. That helps teams bring different sources into one observability workflow. Data retention is 30 days.
Pricing
Elastic Observability has custom pricing, with a 14-day trial. Serverless charges depend on usage, including data ingested and retained, and rates vary by telemetry and project tier; consumption can therefore move with data volume rather than a fixed seat count.
Serverless tiers
Observability Serverless Complete has usage-based rates starting at $0.09/GB for logs and traces ingest and $0.023/GB for metrics ingest. Retention starts at $0.019/GB/month for logs and traces and $0.005/GB/month for metrics. Egress includes 50 GB free, then costs $0.05/GB transferred per month. Its broader scope suits teams seeking a full-stack telemetry setup, and the tier includes private connectivity and IP filtering.
Observability Serverless Logs Essentials starts at $0.07/GB for ingest and $0.017/GB/month for retention, with the same 50 GB free egress allowance and $0.05/GB transferred per month beyond it. It includes ad hoc log analysis, built-in and custom dashboards, integrations, alerts and notifications. This is the more focused fit for log-centered teams; it gives up the stated full-stack scope of Complete. Neither tier has a published fixed total price.
Serverless includes limited support with a Standard subscription. Gold, Platinum and Enterprise support charges are 5%, 10% and 15% of consumption, respectively. Elastic Cloud Serverless has a 99.95% monthly uptime service level agreement. A free plan is also available, but its caps and terms are not established here, so it cannot be compared directly with the priced usage tiers.
Platforms
Elastic supports API, Linux, macOS, Windows, web and self-hosted environments. Deployment choices include Serverless, Hosted and self-managed; Serverless is fully managed, while self-managed deployments can run on customer infrastructure. That flexibility suits organizations with different infrastructure requirements, but buyers should choose their operating model and assess usage costs before treating the headline ingest rates as a budget estimate.
Who it's for
Choose Elastic Observability if your engineering team wants logs, metrics, traces, user experience monitoring and incident workflows under one roof, especially if OpenTelemetry instrumentation or a self-managed deployment matters. It is less compelling for teams that need a known flat price, primarily monitor mobile apps, or only need a lightweight tracing service.
Pros and cons
- Pros: Broad telemetry coverage links logs, metrics, traces and user experience data for cross-service investigation.
- Pros: OpenTelemetry collection without proprietary agents supports vendor-neutral instrumentation.
- Pros: Serverless, Hosted and self-managed choices accommodate both managed operations and customer infrastructure.
- Cons: Usage-based ingest, retention and egress charges make total spend dependent on data volume.
- Cons: Mobile app monitoring is absent, limiting its fit for mobile-first monitoring needs.
- Cons: The free plan's caps are not clear enough to judge whether it can support a production workload.
Alternatives
- Grafana Cloud Application Observability is worth considering when a freemium option matters: its free plan includes 2,232 host hours.
- Uptrace suits readers looking for a free cloud entry point with 50 GB free per month, then $0.075/GB, and unlimited users, services and hosts.
- Honeycomb is an option for event- and metrics-volume-based free usage, with up to 20M events/month, 100M metrics data points/month and two triggers on its free plan.
- Hubble is a free open-source alternative for teams already using Cilium.
- Jaeger is a free, 100% open-source, cloud-native option for self-hosted tracing.
- SigNoz is another freemium choice, with a community self-hosted plan that leaves infrastructure, storage, scaling, upgrades and backups to the user.
- Tracekit may suit a small team seeking a defined free tracing allowance: 200K traces/month, 7-day retention and one team member.
- Grafana Cloud Traces is a free option with 50 GB ingested per month and 14-day retention.
For narrower comparisons, browse Distributed Tracing Tools, eBPF Observability Tools, Log Management Software, Alert Management Software, Observability Platforms and Synthetic Monitoring.
Verdict
Elastic Observability is a strong choice for teams that want broad telemetry analysis and incident response with freedom to run managed or self-managed. Its main reason to choose it is the range of data and workflows it brings together; its main reason to look elsewhere is usage-based pricing, which makes costs harder to pin down, alongside the lack of mobile app monitoring.
Alternatives to Elastic Observability
- 1
Grafana Loki
Free planOpen sourceWebAPILinuxSelf-hosted8.9From $19 a month - 2
Grafana Cloud Application Observability
Free planAndroidiOSWebAPI8.9From $0.03 a month - 3
Logflare
Open sourceAndroidiOSWebAPI8.9$10 usage-based - 4
Google Cloud Logging
Free planiOSWebAPILinux8.8From $0.01 a month - 5

ClickStack
Free planOpen sourceWebAPILinuxSelf-hosted8.6From $53 a month - 6
HyperDX
Free planOpen sourceWebAPILinuxSelf-hosted8.5From $20 a month