Dynatrace Kubernetes Monitoring
Dynatrace Kubernetes Monitoring tracks the health, performance and security of containerized applications and multi-cloud infrastructure using metrics, trace…
What Dynatrace Kubernetes Monitoring is
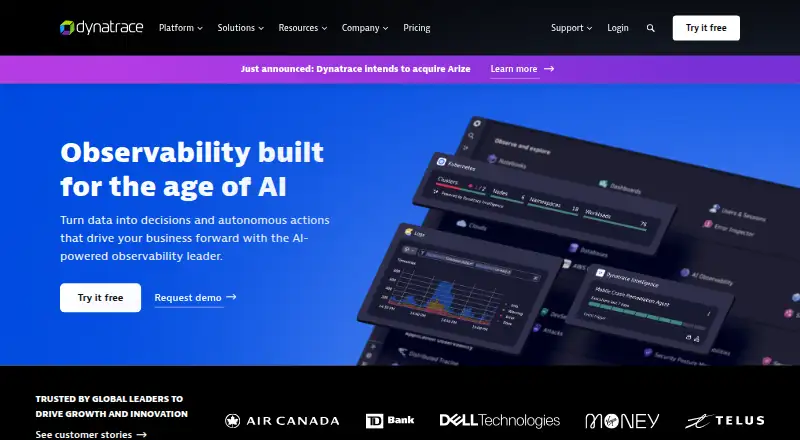
Dynatrace Kubernetes Monitoring tracks the health, performance and security of containerized applications and multi-cloud infrastructure using metrics, traces and logs. It discovers Kubernetes nodes and pods and presents their metrics, events and logs together. The service includes Kubernetes alerting and supports GitOps practices through Monitoring as Code. Exploratory and predictive analyses help identify cluster utilization and workloads that use too many or too few resources. Application insights include distributed tracing, code-level profiling, deployment validation, and automatic root-cause and impact identification. Listed environments include Amazon EKS, Azure AKS, Google GKE, Red Hat OpenShift, Rancher Kubernetes Engine and Kubernetes. Setup uses Dynatrace Operator with Helm or a manifest and requires Dynatrace pods to reach the environment URL. Licensing is by pod-hours and requires a Dynatrace Platform Subscription. The new Kubernetes experience is available only in SaaS environments powered by Grail and AppEngine, not Managed or non-Grail SaaS environments. Dynatrace advertises a 15-day platform trial; there is no free plan.
Good
- Brings node and pod metrics, events and logs together
- Includes out-of-the-box Kubernetes alerting
- Supports GitOps through Monitoring as Code
- Offers tracing, profiling and deployment validation
- Includes exploratory and predictive resource analysis
Watch out
- Requires a Dynatrace Platform Subscription
- Licensed by pod-hours
- New Kubernetes experience excludes Managed and non-Grail SaaS environments
- No free plan is available
Who it suits
It suits platform engineers, site reliability engineers and Kubernetes administrators monitoring clusters and containerized applications. The listed environments include several managed Kubernetes services and distributions.
Verdict
Dynatrace Kubernetes Monitoring combines cluster visibility, alerting and application insights. Check the subscription, pod-hour licensing and SaaS eligibility requirements before choosing it.
Plans and prices
From Dynatrace Kubernetes Monitoring's own pricing page, checked 21 Sep 2026.
| Plan | Price | What it gives you |
|---|---|---|
| Kubernetes Platform Monitoring hourly rate | Free | Hourly consumption rate for Kubernetes Platform Monitoring · Billed at $0.002 per hour per pod |
| Kubernetes Platform Monitoring | $1.40 a month | $1.40 / mo per pod · Kubernetes metrics and events · Included on hosts with Full-Stack Monitoring for no additional charge · Billed at $0.002 per hour per pod |
The facts
Each one read from Dynatrace Kubernetes Monitoring's own pages, with the date it was checked.
What it does
- Alerting and GitOps
- The product provides out-of-the-box Kubernetes alerting and supports GitOps practices with Monitoring as Code.checked 29 Sep 2026
- Cluster visibility
- Continuously discovers Kubernetes nodes and pods and presents their metrics, events, and logs in one view.checked 29 Sep 2026
- Data protection
- Dynatrace describes encryption in transit and at rest, data separation, configurable retention, masking, and hard deletion controls.checked 29 Sep 2026
- Deployment
- The setup guide installs Dynatrace Operator with Helm or a manifest and requires access from Dynatrace pods to the Dynatrace environment URL.checked 29 Sep 2026
- Eligibility limit
- The new Kubernetes experience requires a Dynatrace SaaS environment powered by Grail and AppEngine; it is unavailable for Managed or non-Grail SaaS environments.checked 29 Sep 2026
- Integrations
- The Kubernetes page lists EKS, AKS, GKE, OpenShift, Prometheus, and Fluentd among its integrations and says the platform has 900+ integrations.checked 29 Sep 2026
- Intended users
- Dynatrace says its Kubernetes setup tutorial is intended for platform engineers, site reliability engineers, and Kubernetes administrators.checked 29 Sep 2026
- Licensing requirements
- Kubernetes platform monitoring requires Dynatrace Platform Subscription and is licensed by pod-hours.checked 29 Sep 2026
- Purpose
- Monitors the health, performance, and security of containerized applications and multi-cloud infrastructure using metrics, traces, and logs.checked 29 Sep 2026
- Resource optimization
- Exploratory and predictive analyses help identify cluster utilization and workloads that consume too many or too few resources.checked 29 Sep 2026
- Security and compliance
- Dynatrace's Trust Center lists certifications and frameworks including FedRAMP Moderate, HIPAA, ISO 27001:2022, SOC 2 Type II, and GDPR.checked 29 Sep 2026
- Support
- Standard Support is listed as business-hours access Monday through Friday, while Enterprise Success & Support offers 24/7/365 access.checked 29 Sep 2026
- Supported distributions
- The page lists Amazon EKS, Azure AKS, Kubernetes, Google GKE, Red Hat OpenShift, and Rancher Kubernetes Engine.checked 29 Sep 2026
Where it runs
- Application insights
- Dynatrace describes automatic root-cause and impact identification, distributed tracing, code-level profiling, and deployment validation for Kubernetes environments.checked 29 Sep 2026
The company
- Founded
- 2005checked 28 Sep 2026
- Headquarters
- Boston, Massachusetts, United Stateschecked 28 Sep 2026
Money
- Trial
- Dynatrace advertises a 15-day free trial of its platform.checked 29 Sep 2026
The full review of Dynatrace Kubernetes Monitoring
Dynatrace Kubernetes Monitoring is a paid service for tracking containerized applications and multi-cloud infrastructure through metrics, traces and logs. It is best suited to platform engineers, SREs and Kubernetes administrators who need cluster and application insights together. Its broad monitoring scope is compelling, but pod-hour licensing and strict SaaS eligibility narrow the fit.
Overview
The service brings Kubernetes nodes and pods into a single view with their metrics, events and logs, then connects that cluster picture to application-level tracing and code profiling. Automatic root-cause and impact identification, deployment validation and workload analysis aim to help teams move from detecting a problem to locating its source.
It supports Amazon EKS, Azure AKS, Google GKE, Red Hat OpenShift, Rancher Kubernetes Engine and Kubernetes. The Kubernetes page names EKS, AKS, GKE, OpenShift, Prometheus and Fluentd integrations, while the broader platform has 900+ integrations. Setup uses the Dynatrace Operator installed with Helm or a manifest, and Dynatrace pods need access to the environment URL.
Key features
- Cluster visibility: Continuous discovery of nodes and pods puts metrics, events and logs together, which is useful when operators need infrastructure context without switching between separate views.
- Alerting and GitOps: Out-of-the-box Kubernetes alerts reduce the need to build basic alerting from scratch. Monitoring as Code supports teams that manage monitoring through GitOps practices.
- Resource optimization: Exploratory and predictive analysis can surface underused capacity as well as workloads consuming too much. That makes the feature relevant both to teams seeking efficiency and those diagnosing resource pressure.
- Application insights: Distributed tracing, code-level profiling, root-cause and impact identification, and deployment validation extend monitoring beyond cluster health. This is a meaningful advantage for teams investigating how Kubernetes issues affect applications, though it adds little for buyers seeking only basic host alerts.
- Operational coverage: The product includes container metrics and log collection, resource alerts, runtime events, custom metrics, SLO tracking and synthetic monitoring. Telemetry covers metrics, logs, traces and events; data retention is 35 days and the check interval is one minute.
Pricing
Dynatrace is paid, with a 15-day free trial of its platform and no free plan. Kubernetes platform monitoring requires a Dynatrace Platform Subscription and is licensed by pod-hours. The hourly rate is $0.002 per pod-hour. The listed Kubernetes Platform Monitoring rate is $1.40 / mo per pod, including Kubernetes metrics and events; it is included on hosts with Full-Stack Monitoring at no additional charge. The hourly-rate listing shows free, but its billed rate is still $0.002 per hour per pod.
That makes the per-pod rate easy to relate to usage, but costs depend on pod-hours rather than a simple fixed cluster fee. Teams should account for workload scale and the Platform Subscription requirement before choosing it; the 15-day trial offers a short evaluation window, not ongoing free monitoring.
The new Kubernetes experience requires a Dynatrace SaaS environment powered by Grail and AppEngine. It is unavailable on Managed or non-Grail SaaS environments, so organizations committed to those deployment options cannot use that experience.
Platforms
The service lists Android, iOS, Linux, API, web and self-hosted support, with a hybrid deployment model. Kubernetes coverage spans the major managed cloud distributions as well as OpenShift and Rancher. Security and compliance controls include encryption in transit and at rest, data separation, configurable retention, masking and hard deletion. Dynatrace's Trust Center lists FedRAMP Moderate, HIPAA, ISO 27001:2022, SOC 2 Type II and GDPR. Standard Support is available during business hours Monday through Friday; Enterprise Success & Support offers 24/7/365 access.
Who it's for
This is a strong fit for platform engineers, site reliability engineers and Kubernetes administrators who need cluster telemetry tied to application behavior, plus alerting and resource analysis. It is less suitable for teams that need a free tier, cannot use the eligible Grail-and-AppEngine SaaS environment, or want pricing independent of pod consumption.
Pros and cons
- Pro: Cluster metrics, events and logs share a view, while tracing and code profiling add application context for deeper investigations.
- Pro: Monitoring as Code and out-of-the-box alerting suit teams building Kubernetes operations into established workflows.
- Pro: Broad distribution support and 900+ platform integrations can help fit monitoring into a wider environment.
- Con: Pod-hour licensing and the required Platform Subscription make total cost dependent on usage and subscription terms.
- Con: The new experience's Grail-and-AppEngine SaaS requirement excludes Managed and non-Grail SaaS environments.
- Con: No free plan is offered, and the 15-day trial is brief for teams that need a longer evaluation.
Alternatives
Choose ManageEngine OpManager if a perpetual free edition covering three devices is a better starting point, or if you want its standard edition at $95 a year. New Relic Kubernetes Monitoring is worth comparing if a free plan matters; its Pro plan is $349 a year for annual commitments, with unlimited full platform users and 100 GB free data ingest before $0.40/GB beyond that limit.
Riverbed Aternity is an enterprise digital experience management offering with custom pricing. Elastic Observability is another paid observability option, with a free plan and trial. Site24x7 Server Monitoring offers a free plan and a Lite infrastructure plan at $9 a month, paid annually. Sumo Logic has a free plan with 20 daily credits, seven-day log retention and up to three users. Opsview Cloud is a paid cloud option with a free trial, and Ceburu offers paid custom enterprise pricing.
For broader category comparisons, browse IT Operations Management Software, Metrics Monitoring Tools, Application Dependency Mapping Software, DNS Monitoring Software, Synthetic Monitoring and Observability Platforms.
Verdict
Choose Dynatrace Kubernetes Monitoring if your team needs cluster operations and application-level diagnosis in one system and can meet its SaaS eligibility requirements. Its strongest reason to buy is the combination of Kubernetes visibility, alerting, resource analysis and application insights; look elsewhere if a free plan, Managed deployment or costs untied to pod-hours are essential.
Getting started
- Start a 15-day free trial of the Dynatrace platform
- Confirm the environment meets the SaaS, Grail, and AppEngine requirements for the new Kubernetes experience
- Install Dynatrace Operator using Helm or a manifest
- Provide Dynatrace pods access to the Dynatrace environment URL
- Use a Dynatrace Platform Subscription for Kubernetes platform monitoring
Limits worth knowing
Kubernetes platform monitoring is licensed by pod-hours and requires a Dynatrace Platform Subscription. The new Kubernetes experience is unavailable for Managed and non-Grail SaaS environments.
Questions
Is there a free plan?
No. Dynatrace advertises a 15-day free trial of its platform.
How is Kubernetes monitoring priced?
Kubernetes Platform Monitoring is billed at $0.002 per hour per pod, equivalent to $1.40 per month per pod. It requires a Dynatrace Platform Subscription.
Which Kubernetes environments are supported?
The listed environments are Amazon EKS, Azure AKS, Kubernetes, Google GKE, Red Hat OpenShift, and Rancher Kubernetes Engine.
What does setup involve?
Install Dynatrace Operator with Helm or a manifest, and ensure Dynatrace pods can access the Dynatrace environment URL.
Can the new Kubernetes experience run in any Dynatrace environment?
It requires a Dynatrace SaaS environment powered by Grail and AppEngine. It is unavailable for Managed and non-Grail SaaS environments.
Who makes Dynatrace?
Dynatrace was founded in 2005 and is headquartered in Boston, Massachusetts, United States.
Alternatives to Dynatrace Kubernetes Monitoring
- 1

Checkmk
Free planOpen sourceAndroidiOSWebAPI8.8From $275 a month - 2
Netdata
Free planOpen sourceAndroidiOSWebAPI8.7From $4.50 a month - 3

Portainer
Free planOpen sourceAndroidiOSWebAPI8.6Free plan - 4
Uptrace
Free planOpen sourceWebAPILinuxmacOS8.4From $39 a month - 5
Coroot
Free planOpen sourceWebAPILinuxSelf-hosted8.2From $1 a month - 6

Middleware
Free planAndroidiOSWebAPI8.2$0.30 usage-based