Tracy Profiler
- Android app
- Yes
- Free plan
- Yes
- Runs on
- Android, iOS, Linux, Mac, self-hosted, Windows
Summary
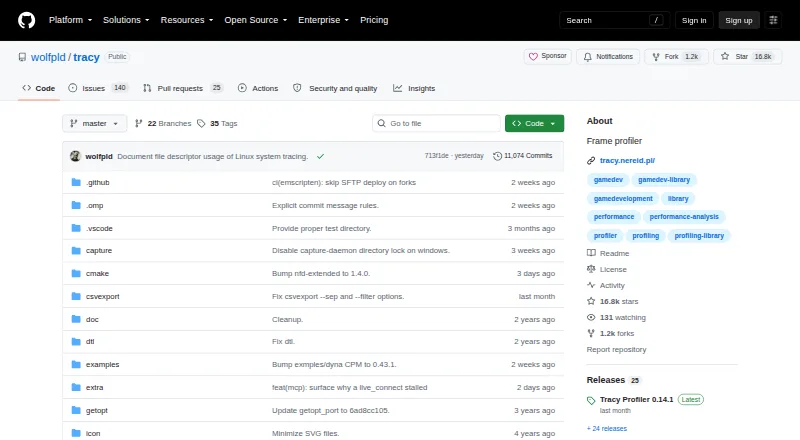
Tracy Profiler is a free remote telemetry profiler for games and other applications, designed for real-time analysis at nanosecond resolution. It provides CPU profiling integrations for C, C++, Lua, Python and Fortran, and GPU profiling support for OpenGL, Vulkan, Direct3D 11/12, Metal, OpenCL, CUDA and WebGPU. It can also capture memory allocations, locks and context switches, and associate screenshots with recorded frames. The project points to third-party bindings for languages such as Rust, Zig, C#, OCaml and Odin. A capture daemon discovers Tracy clients over UDP and saves captures separately, while a merge tool combines traces from multiple processes. Merged traces retain zones, messages and plots, but not GPU zones, memory events or call stacks. Sampling can heuristically reconstruct zone call stacks. An assistant can analyze captured data using llama.cpp models, but local setup is required. Tracy uses the 3-clause BSD license. Releases include PDF documentation and compiled Windows x64 binaries; prebuilt profiler binaries are available for Windows, macOS and Linux.
Who it is for
Tracy suits developers profiling games and other applications, particularly those working with its listed CPU or GPU technologies. It supports several operating systems, including Windows, Linux, macOS, Android and iOS.
What is good
- Free under the 3-clause BSD license.
- Supports CPU profiling for five listed languages.
- Covers a broad set of GPU APIs.
- Captures memory, locks, context switches and frame screenshots.
- Capture daemon discovers clients over UDP.
What to know first
- Merged traces omit GPU zones, memory events and call stacks.
- Assistant integration requires local setup.
- Prebuilt profiler binaries are listed for Windows, macOS and Linux.
Everything Xiaomi review
Tracy Profiler: the full review
Tracy offers broad CPU, GPU and system telemetry capture for game and application profiling. Its trace merging drops some data types, so retain that limitation in mind when combining captures.
Overview
Tracy Profiler is a real-time tool for profiling games and other applications through remote telemetry, frame profiling and sampling at nanosecond resolution. It suits developers who need to inspect CPU and GPU work alongside system-level events, rather than only monitor frame rates. Its broad capture scope is a clear strength, but merged traces do not retain every captured data type.
Released under the 3-clause BSD license, Tracy pairs instrumentation with a profiler interface and supports local analysis of captured data through an AI assistant integration. It is a focused engineering tool, best suited to teams able to work directly with profiling integrations and trace files.
Key features
CPU and GPU coverage
Direct CPU profiling integrations cover C, C++, Lua, Python and Fortran, while the project points to third-party bindings for Rust, Zig, C#, OCaml and Odin, among other languages. GPU support spans OpenGL, Vulkan, Direct3D 11 and 12, Metal, OpenCL, CUDA and WebGPU. That range makes Tracy a practical option for projects with varied graphics stacks; teams using languages outside the direct integrations should account for the third-party nature of those bindings.
Trace detail and capture
Along with frame-time analysis, Tracy can capture memory allocations, locks and context switches, and associate screenshots with captured frames. This combination helps developers relate performance events to both system activity and visual output. Its remote profiling support and 0.14 capture daemon extend that workflow: the daemon discovers Tracy clients over UDP and saves each capture to its own file.
Merging and sampling
The 0.14 release also added a tool to combine multi-process traces. The merge retains zones, messages and plots, but drops GPU zones, memory events and call stacks. That is a meaningful constraint for investigations where those data are central: keep the separate captures when their full detail matters. With sampling enabled, Tracy can heuristically reconstruct zone call stacks, which adds context but should not be treated as a substitute for data the merge discards.
Local assistant
An assistant integration uses llama.cpp models to analyze captured Tracy data and can run locally after setup. Keeping that analysis on the user's system is useful for developers who want a private workflow, though it requires local configuration rather than being an automatic, hosted feature.
Pricing
Tracy Profiler is free: the plan costs 0.00 USD per free under the 3-clause BSD license. There is no paid tier or trial to weigh against a free allowance, so the central trade-off is technical fit rather than plan limits. The license permits use, copying, modification, publication and distribution.
Platforms
Supported platforms include Windows, Linux, Android, FreeBSD, WSL, macOS, iOS and QNX. Prebuilt profiler binaries are provided for Windows, macOS and Linux; GitHub releases also include compiled Windows x64 binaries and the user documentation as a PDF. Users of other supported platforms should distinguish platform support from the narrower availability of prebuilt profiler binaries.
Who it's for
Tracy is a strong fit for game and application developers who need detailed CPU, GPU and system telemetry, remote capture, or profiling across multiple processes. Its wide API coverage and free BSD licensing suit technically equipped teams that want to instrument their own software. It is a weaker fit for readers seeking a simple frame-rate monitor, or for workflows that depend on preserving GPU zones, memory events and call stacks in merged traces.
Pros and cons
- Pro: Broad telemetry in one profiler. CPU, GPU, memory, locks, context switches and frame-associated screenshots support investigations beyond frame timing alone.
- Pro: Wide graphics API and language reach. Direct integrations and third-party bindings cover many common development stacks.
- Pro: Free under a permissive license. The 3-clause BSD license allows modification and redistribution.
- Con: Merging loses important trace data. GPU zones, memory events and call stacks do not survive multi-process trace merging.
- Con: The local assistant needs setup. Its privacy advantage comes with the responsibility of configuring it on the user's system.
- Con: Prebuilt profiler binaries cover fewer platforms than the support list. Windows, macOS and Linux have prebuilt binaries; other supported platforms may require a different workflow.
Alternatives
For a broader shortlist, see Game Profiling Software.
- GameBench is worth considering for readers who want a paid product with a 30-minute Pro trial and unlimited sessions for 28 days.
- Arm Performance Studio is another free choice, particularly for profiling Arm CPU and GPU applications.
- RAD Telemetry is an alternative with custom telemetry licensing.
- Optick is a free profiler under the MIT License.
- RenderDoc is a free MIT-licensed option for readers comparing tools in this category.
- AMD Radeon GPU Profiler is a free alternative for users with a supported AMD Radeon GPU and operating system.
- MicroProfile is an embeddable C++ profiler to consider when that format suits the project.
- Unity offers a free tier with pay-as-you-go usage beyond included limits.
Verdict
Choose Tracy if you need detailed, remotely captured CPU, GPU and system traces across a broad set of graphics APIs, and can work within its instrumentation-led approach. Its free BSD license and extensive telemetry make it compelling for serious game and application profiling. Look elsewhere when merged captures must preserve GPU, memory and call-stack data, or when you need a less technical profiling workflow.
Tracy Profiler plans and pricing
All plansCompared on game profiling software
- Free plan
- Yesgithub.com
- CPU profiling
- Yesgithub.com
- GPU profiling
- Yesgithub.com
- Memory profiling
- Yesgithub.com
- Frame-time analysis
- Yesgithub.com
- Remote profiling
- Yesgithub.com
- Supported platforms
- Windows, Linux, Android, FreeBSD, WSL, macOS, iOS, QNX; prebuilt profiler binaries for Windows, macOS, and Linuxgithub.com
Facts
- Purpose
- Tracy is a real-time, nanosecond-resolution remote telemetry, hybrid frame and sampling profiler for games and other applications.github.com · 29 Sept 2026
- Other captured data
- It can profile memory allocations, locks and context switches, and attribute screenshots to captured frames.github.com · 29 Sept 2026
- Third-party bindings
- The project points to third-party bindings for Rust, Zig, C#, OCaml and Odin, among other languages.github.com · 29 Sept 2026
- Distribution
- GitHub releases include the user documentation as tracy.pdf and compiled Windows x64 binaries.github.com · 29 Sept 2026
- Trace automation
- The 0.14 release added a capture daemon that discovers Tracy clients over UDP and captures each to a separate file, plus a tool to merge multi-process traces.github.com · 29 Sept 2026
- Merge limitation
- The release notes say trace merging preserves zones, messages and plots, while GPU zones, memory events and call stacks are lost.github.com · 29 Sept 2026
- AI assistant
- The release notes describe an assistant integration that can run locally and analyze captured data; they state local setup is required and that running it locally keeps activity private.github.com · 29 Sept 2026
- License
- Tracy Profiler is licensed under the 3-clause BSD license.github.com · 29 Sept 2026
- Maintainer
- The license names Bartosz Taudul as the copyright holder for 2017–2026.github.com · 29 Sept 2026
- Security
- The 0.14.1 release notes say string-length encoding in the protocol was hardened.github.com · 29 Sept 2026
- Other telemetry
- It can profile memory allocations, locks and context switches, and attribute screenshots to captured frames.github.com · 30 Sept 2026
- Remote capture
- The project describes Tracy as a remote telemetry profiler.github.com · 30 Sept 2026
- Automated capture
- The 0.14 release added a capture daemon that discovers Tracy clients over UDP and captures each to its own file.github.com · 30 Sept 2026
- Trace merging
- The 0.14 release added a tool to combine multi-process traces; the release notes say the implementation preserves zones, messages and plots, while GPU zones, memory events and call stacks are lost.github.com · 30 Sept 2026
- Sampling
- The 0.14 release notes describe heuristic reconstruction of zone call stacks when sampling is enabled.github.com · 30 Sept 2026
- Assistant integration
- The 0.14 release notes describe an LLM assistant integration using llama.cpp models and captured Tracy data for analysis.github.com · 30 Sept 2026
- Local privacy
- The 0.13 release notes say the assistant runs locally on the user's system and that its activity stays private.github.com · 30 Sept 2026
- Downloads
- The repository's releases provide the Tracy PDF documentation and compiled Windows x64 binaries as assets.github.com · 30 Sept 2026
- Intended users
- The project describes Tracy as a profiler for games and other applications.github.com · 30 Sept 2026
Best Tracy Profiler alternatives
See all 20


Where it ranks on Everything Xiaomi
Is Tracy Profiler yours?
Claim it for free: prove the domain, then correct facts, plans and screenshots. An editor reviews every change.
Sources
- github.com/wolfpld/tracy· checked 29 Sept 2026
- github.com/wolfpld/tracy/releases· checked 29 Sept 2026
- github.com/wolfpld/tracy/blob/master/LICENSE· checked 29 Sept 2026
- github.com/wolfpld/tracy/blob/master/README.md· checked 30 Sept 2026