OpenTelemetry eBPF Profiler
OpenTelemetry eBPF Profiler is a Linux-only, self-hosted tool for whole-system profiling across native code and multiple language runtimes.
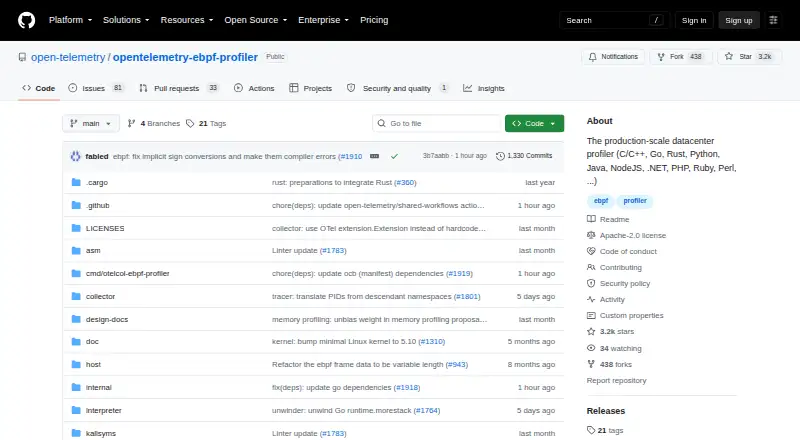
What OpenTelemetry eBPF Profiler is
OpenTelemetry eBPF Profiler is a Linux-only, self-hosted tool for whole-system profiling across native code and multiple language runtimes. It uses eBPF and can produce mixed stack traces from kernel space through system libraries to high-level languages, including native inline frames. It supports C/C++, Rust, Zig, Go, HotSpot JVM, Python, Ruby, PHP, Node.js, V8, Perl, Erlang and .NET. Profiling does not require loading agents or libraries into profiled processes, changing runtime settings, adding instrumentation, or restarting interpreters and VMs. The project reports tested upper limits of 1% CPU and 250 MB of memory, with typical use below those limits. Its supported deployment path is as a receiver in the OpenTelemetry Collector. Pyroscope is named as a database that can ingest OpenTelemetry profiling data, though mature production-ready backends have yet to emerge. The Profiles signal implementation is functional but still evolving. Builds support amd64 and arm64; recent commits may require Linux kernel 5.10 or newer.
Good
- Profiles native code and numerous language runtimes.
- Captures stack traces across kernel and user space.
- Does not require in-process agents or runtime restarts.
- Collector receiver is the supported configuration.
- Free and open source under Apache License 2.0.
Watch out
- Linux only; recent commits may require kernel 5.10+.
- Profiles signal implementation is still evolving.
- Mature production-ready backends have yet to emerge.
- Standalone binaries are unsupported and unsuitable for production.
Who it suits
It suits teams profiling Linux systems across native code and multiple language runtimes without adding in-process agents or restarting runtimes. Users should be prepared to self-host and use the Collector receiver configuration.
Verdict
OpenTelemetry eBPF Profiler offers broad Linux profiling without modifying profiled processes. Its evolving signal and limited production-backend options are important considerations for deployment.
The facts
Each one read from OpenTelemetry eBPF Profiler's own pages, with the date it was checked.
What it does
- Architecture
- The project supports amd64 and arm64 builds, and says macOS and Windows users need a Linux VM to build and run the agent.checked 4 Oct 2026
- Architecture support
- The project supports ARM64 unwinders and says its provided build targets support amd64 and arm64.checked 4 Oct 2026
- Backend integration
- The README names Pyroscope as an open-source database that natively supports ingesting OpenTelemetry profiling data.checked 4 Oct 2026
- Backends
- The README names Pyroscope as an open-source database that natively supports ingesting OpenTelemetry profiling data, and says mature production-ready backends have yet to emerge.checked 4 Oct 2026
- Collector integration
- The project says its profiler is integrated into the OpenTelemetry Collector as a receiver and identifies that configuration as the supported path going forward.checked 4 Oct 2026
- Community and support
- The project invites bug reports, feature requests, documentation improvements, and code contributions, and directs discussion to the #otel-profiles channel on CNCF Slack.checked 4 Oct 2026
- Development backend limitation
- The README says devfiler is for testing, experimentation and development, and should not be used as a production backend.checked 4 Oct 2026
- Development binaries
- The standalone agent and local Collector receiver binaries are described as unsupported, subject to removal, and unsuitable for production deployment.checked 4 Oct 2026
- Languages
- It supports native code including C/C++, Rust, Zig and Go, as well as Hotspot JVM, Python, Ruby, PHP, Node.js, V8, Perl, Erlang and .NET.checked 4 Oct 2026
- License
- The project is licensed under Apache License 2.0, and its eBPF source code is licensed under GPL 2.0.checked 4 Oct 2026
- Low overhead
- The project says its tested upper limits are 1% CPU and 250 MB of memory, and that the agent typically stays well below those limits.checked 4 Oct 2026
- No in-process agent
- Profiling does not require loading agents or libraries into the processes being profiled.checked 4 Oct 2026
- Non-intrusive profiling
- The profiler does not need to load agents or libraries into profiled processes or require interpreter and VM reconfiguration, instrumentation, or restarts.checked 4 Oct 2026
- No runtime changes
- The agent supports unwinding supported languages in their default configuration without reconfiguration, instrumentation or interpreter or VM restarts.checked 4 Oct 2026
- OpenTelemetry integration
- The profiler is integrated into the OpenTelemetry Collector as a receiver, which the project identifies as the supported configuration going forward.checked 4 Oct 2026
- Profile format
- It implements the Alpha OpenTelemetry Profiles signal.checked 4 Oct 2026
- Profiling signal status
- The agent has a functional but work-in-progress, evolving implementation of the recently released Alpha OpenTelemetry Profiles signal.checked 4 Oct 2026
- Purpose
- It is a whole-system, cross-language profiler for Linux that uses eBPF.checked 4 Oct 2026
- Security reporting
- The security policy asks reporters not to use public GitHub issues and recommends the repository’s private vulnerability reporting channel.checked 4 Oct 2026
- Stack traces
- It supports mixed stack traces from kernel space through system libraries into high-level languages, and native inline frames.checked 4 Oct 2026
- Standalone binary limitation
- The standalone profiling agent and local profiling-receiver binaries are described as unsupported, potentially removable, and unsuitable for production deployment.checked 4 Oct 2026
- Support and community
- The project says it is developed by the OpenTelemetry Profiling SIG and directs questions and discussion to the #otel-profiles channel on CNCF Slack.checked 4 Oct 2026
- System requirements
- The profiler is Linux-only; later commits may require Linux kernel 5.10 or newer, while earlier commits supported kernels down to 5.4 or 4.19.checked 4 Oct 2026
Where it runs
- Linux requirement
- The profiler is Linux-only; recent commits may require Linux kernel 5.10 or later, while earlier commits supported 5.4 or 4.19.checked 4 Oct 2026
Alternatives to OpenTelemetry eBPF Profiler
- 1
Grafana Cloud Application Observability
Free planAndroidiOSWebAPI8.4From $0.03 a month - 2
Coroot
Free planOpen sourceWebAPILinuxSelf-hosted8.2From $1 a month - 3

Middleware
Free planAndroidiOSWebAPI8.2$0.30 usage-based - 4
Alibaba Cloud ARMS RUM
AndroidiOSWebAPI7.5$0.02 usage-based - 5
Metoro Kubernetes Profiling
Free planWebAPILinuxSelf-hosted7.5From $20 a month - 6

OneUptime
Free planWebAPILinuxSelf-hosted7.0From $0.10 a month