Kloudfuse Continuous Profiling
Kloudfuse Continuous Profiling continuously collects CPU, memory, and contention profiles from production and stores them with other telemetry in the same da…
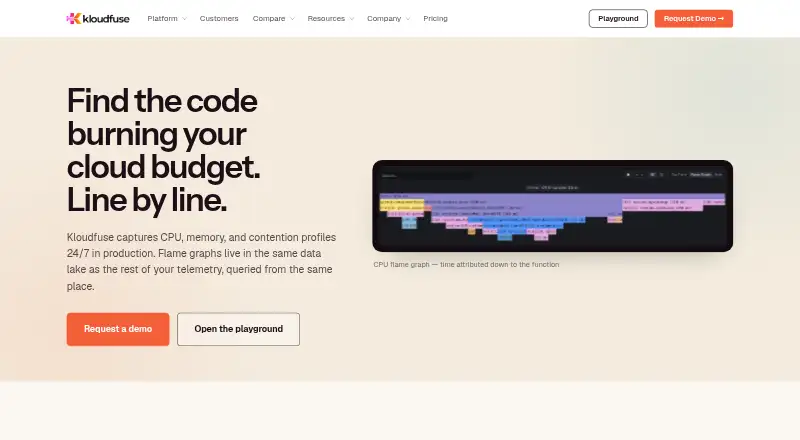
What Kloudfuse Continuous Profiling is
Kloudfuse Continuous Profiling continuously collects CPU, memory, and contention profiles from production and stores them with other telemetry in the same data lake. It captures CPU, memory allocation, mutex contention, block, goroutine, wall-clock, and disk I/O profiles, shown as interactive flame graphs down to function and line. Grafana Alloy pulls standard pprof endpoints through the Pyroscope protocol without proprietary agents or sidecars. In Kubernetes, Alloy can discover services through pod annotations and automatically profile newly ready pods. Go and Java have first-class support; Pyroscope SDK-instrumented Python, Ruby, Node.js, .NET, and Rust applications are also compatible. Profiles use Apache Parquet, with retention on a local PVC defaulting to 50 GB or longer storage on S3 or GCS. The Kloudfuse MCP Server accepts natural-language profiling queries, while K-Lens ranks attributes linked to anomalies to suggest root-cause hypotheses. Deployment options include self-operated, co-managed, and fully managed, with the data plane in the customer VPC under customer-managed keys. Pricing is on request.
Good
- Continuous production profiling
- Interactive function-level flame graphs
- Automatic Kubernetes service discovery
- Natural-language profiling queries
- Customer-managed keys in customer VPC
Watch out
- Pricing requires a quote
- Local PVC defaults to 50 GB
- Some languages require Pyroscope SDK instrumentation
- FedRAMP guidance requires contacting the team
Who it suits
This product suits engineering and on-call teams analyzing production performance across supported languages and Kubernetes services. It also fits organizations needing customer-VPC deployment and configurable profile retention.
Verdict
Kloudfuse Continuous Profiling combines broad profile types, Kubernetes discovery, and data-lake retention with query and anomaly-analysis tools. Its deployment choices and security model support teams that need control over where profiling data runs.
Plans and prices
From Kloudfuse Continuous Profiling's own pricing page, checked 9 Oct 2026.
| Plan | Price | What it gives you |
|---|---|---|
| Kloudfuse Continuous Profiling | Priced on request | Pricing is quoted for the platform by telemetry-volume tier; profiling stores to a 50 GB default PVC, with S3/GCS available for longer retention |
The facts
Each one read from Kloudfuse Continuous Profiling's own pages, with the date it was checked.
What it does
- Analysis
- The Kloudfuse MCP Server supports natural-language profiling queries, while K-Lens ranks attributes associated with profiling anomalies to suggest root-cause hypotheses.checked 9 Oct 2026
- Audience
- The company describes the platform as built for engineering and on-call teams, and says it is used in healthcare, financial services, and regulated government environments.checked 9 Oct 2026
- Collection
- Grafana Alloy scrapes standard pprof endpoints using the Pyroscope protocol in pull mode, without proprietary agents or sidecars.checked 9 Oct 2026
- Compliance
- Kloudfuse says it supports SOC 2 Type II and FIPS 140-3 validated cryptography, and advises contacting its team about FedRAMP.checked 9 Oct 2026
- Deployment and security
- Kloudfuse says the data plane runs in the customer's VPC under customer-managed keys, with self-operated, co-managed, and fully managed operation options.checked 9 Oct 2026
- Kubernetes discovery
- Grafana Alloy discovers Kubernetes services using pod annotations, and newly ready pods can be profiled automatically.checked 9 Oct 2026
- Language compatibility
- Go and Java have first-class support; Pyroscope SDK-instrumented Python, Ruby, Node.js, .NET, and Rust applications are also compatible.checked 9 Oct 2026
- Limits
- The pricing page lists telemetry tiers through 30–50 TB/day and says exact platform pricing requires a quote; it does not publish prices there.checked 9 Oct 2026
- Profile types
- It captures CPU, memory allocation, mutex contention, block, goroutine, wall-clock, and disk I/O profiles, displayed as interactive flame graphs down to function and line.checked 9 Oct 2026
- Purpose
- Kloudfuse collects CPU, memory, and contention profiles continuously from production and keeps them in the same data lake as other telemetry.checked 9 Oct 2026
- Retention
- Profiles use Apache Parquet, with configurable retention on a local PVC that defaults to 50 GB or longer-term storage on S3/GCS.checked 9 Oct 2026
The company
- Company
- Kloudfuse says it was founded in 2020 and is headquartered in Cupertino, California.checked 9 Oct 2026
- Founded
- 2020checked 28 Sep 2026
- Headquarters
- Cupertino, CAchecked 28 Sep 2026
Money
- Trial access
- The playground provides access to a live observability environment with no install and no credit card, and asks for a work email.checked 9 Oct 2026
Alternatives to Kloudfuse Continuous Profiling
- 1
Grafana Cloud Application Observability
Free planAndroidiOSWebAPI8.4From $0.03 a month - 2
Coroot
Free planOpen sourceWebAPILinuxSelf-hosted8.2From $1 a month - 3

Middleware
Free planAndroidiOSWebAPI8.2$0.30 usage-based - 4
Alibaba Cloud ARMS RUM
AndroidiOSWebAPI7.5$0.02 usage-based - 5
Metoro Kubernetes Profiling
Free planWebAPILinuxSelf-hosted7.5From $20 a month - 6

OneUptime
Free planWebAPILinuxSelf-hosted7.0From $0.10 a month