YourKit .NET Profiler
YourKit .NET Profiler analyzes CPU performance and memory in .NET and .NET Core applications.
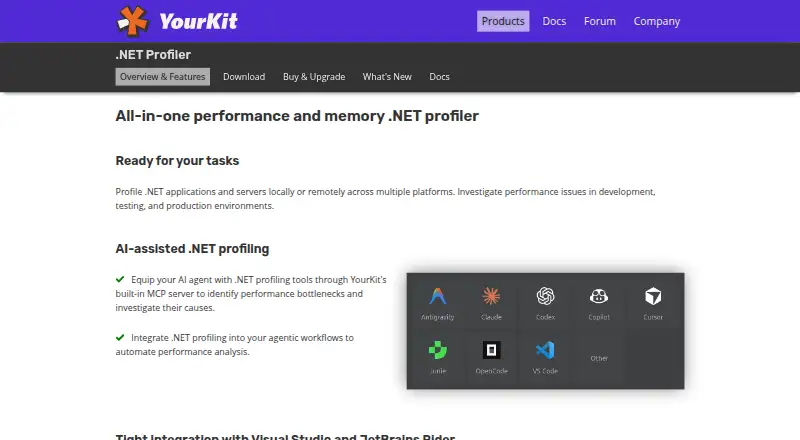
What YourKit .NET Profiler is
YourKit .NET Profiler analyzes CPU performance and memory in .NET and .NET Core applications. It can profile servers, Windows services, and other .NET applications locally or remotely during development, testing, and production. CPU results can be viewed as call trees or hot spots, while memory analysis visualizes the object heap and object graph. Plugins integrate with Microsoft Visual Studio and JetBrains Rider. The profiler can show slow SQL queries and ASPX requests and supports MongoDB and Cassandra. More than 20 inspections can identify issues such as duplicated objects, unclosed database connections, inefficient collections, and I/O operations. Remote profiling can use an SSH tunnel, while a .NET API and command-line tools support profiling automation and continuous-integration monitoring. Version 2026.9 supports .NET 5 through .NET 10 and .NET Framework 4.x, with downloads for Linux, macOS, and Windows architectures. A purchased license permits profiling any number of .NET applications simultaneously. Annual single-seat licenses cost $99 a year; a perpetual single-seat license costs $129, paid once.
Good
- Profiles .NET and .NET Core applications.
- CPU views include call trees and hot spots.
- Integrates with Visual Studio and JetBrains Rider.
- Supports remote profiling through an SSH tunnel.
- Includes more than 20 performance inspections.
Watch out
- Annual single-seat license costs $99 a year.
- Perpetual single-seat license costs $129, paid once.
- Enterprise pricing requires contacting sales.
Who it suits
YourKit .NET Profiler suits developers and teams analyzing .NET application performance and memory locally or remotely. Its API, command-line tools, and CI monitoring support suit automated profiling workflows.
Verdict
YourKit .NET Profiler provides CPU and memory analysis alongside remote profiling and automation tools. Consider the license type and seat count that match your team.
Plans and prices
From YourKit .NET Profiler's own pricing page, checked 8 Oct 2026.
| Plan | Price | What it gives you |
|---|---|---|
| Open source and free license | Free | Open source project contributors and Microsoft MVPs · Contact sales regarding a free license |
| Seat — annual subscription, single-seat | $99 a year | Single seat · transferable between machines and developers · $99/€99; 1 year of support and upgrades |
| Seat — perpetual, single-seat | $129, paid once | Single seat · transferable between machines and developers · $129/€129; includes 1 year of support and upgrades |
| Seat — annual subscription, five-seat | $299 a year | Five seats · $299/€299; 1 year of support and upgrades |
| Seat — perpetual, five-seat | $389, paid once | Five seats · $389/€389; includes 1 year of support and upgrades |
| Floating — annual subscription, single-user | $499 a year | Single user · centralized license management · $499/€499; 1 year of support and upgrades |
| Floating — perpetual, single-user | $649, paid once | Single user · centralized license management · $649/€649; includes 1 year of support and upgrades |
| Floating — annual subscription, five-user | $1,499 a year | Five users · centralized license management · $1,499/€1,499; 1 year of support and upgrades |
| Floating — perpetual, five-user | $1,949, paid once | Five users · centralized license management · $1,949/€1,949; includes 1 year of support and upgrades |
| Enterprise | Priced on request | For companies with more than 50 profiler installations · Contact sales for a tailored proposal |
The facts
Each one read from YourKit .NET Profiler's own pages, with the date it was checked.
What it does
- AI tooling
- The download page describes a built-in MCP server for connecting AI tools such as Claude Desktop, Codex, or OpenCode to analyze profiler snapshots.checked 8 Oct 2026
- Automation and API
- A .NET API can manage profiling modes and capture snapshots, and command-line tools can automate profiling tasks and performance monitoring in continuous integration.checked 8 Oct 2026
- CPU and memory analysis
- CPU profiles can be displayed as call trees or hot spots, and the profiler visualizes the object heap and object graph.checked 8 Oct 2026
- Database and web requests
- The profiler shows slow SQL queries and ASPX requests and supports MongoDB and Cassandra.checked 8 Oct 2026
- Development integrations
- Plugins integrate the profiler with Microsoft Visual Studio and JetBrains Rider.checked 8 Oct 2026
- License scope
- A purchased license is multi-platform and permits profiling any number of .NET applications simultaneously.checked 8 Oct 2026
- Performance inspections
- More than 20 inspections can identify issues such as duplicated objects, unclosed database connections, inefficient collections, and I/O operations.checked 8 Oct 2026
- Purpose
- YourKit .NET Profiler profiles performance and memory in .NET and .NET Core applications.checked 8 Oct 2026
- Remote profiling
- Remote profiling tools can create an SSH tunnel to connect to an application on a remote machine.checked 8 Oct 2026
- Runtime and architecture support
- Version 2026.9 supports .NET 5 through .NET 10 and .NET Framework 4.x, with profiling downloads for Linux, macOS, and Windows architectures.checked 8 Oct 2026
- Security and license data
- The privacy policy says license checks may transfer product, platform, operating system, license key, and machine-binding information over HTTPS, storing received information as hashes or a mangled form.checked 8 Oct 2026
- Support
- Active support includes unlimited-incident email support and help with installation, product use, and general questions.checked 8 Oct 2026
Where it runs
- Application coverage
- It profiles servers, Windows services, and other .NET applications locally or remotely in development, testing, and production.checked 8 Oct 2026
The company
- Headquarters
- Düsseldorf, Germanychecked 28 Sep 2026
- Maker and headquarters
- YourKit GmbH lists its headquarters in Düsseldorf, Germany.checked 8 Oct 2026
The full review of YourKit .NET Profiler
YourKit .NET Profiler is a desktop tool for examining CPU and memory performance in .NET and .NET Core applications. It suits developers and teams diagnosing application behavior across development, testing, and production. Its breadth of analysis and remote automation is compelling, though seat and license choices make cost a meaningful part of the decision.
Overview
The profiler covers servers, Windows services, and other .NET applications, whether they run locally or on a remote machine. CPU call trees and hot spots help locate expensive work, while heap and object-graph views expose memory use. This combination is useful when a team needs to investigate both execution time and object retention in one tool.
Its scope goes beyond snapshots: database and web request views, issue inspections, IDE plugins, and automation support make it relevant to ongoing development and production diagnosis. The trade-off is focus: this is specifically for .NET profiling, not a general-purpose profiler across unrelated languages.
Key features
- CPU, memory, and threads: CPU data appears as call trees or hot spots, and memory analysis visualizes the object heap and object graph. Thread profiling is also supported, giving .NET teams several complementary angles on performance.
- Application and request diagnostics: It can surface slow SQL queries and ASPX requests, with support for MongoDB and Cassandra. More than 20 inspections can flag problems including duplicated objects, unclosed database connections, inefficient collections, and I/O operations. These inspections can help narrow investigation, though they do not replace understanding the application's workload.
- Remote and automated workflows: Remote profiling can establish an SSH tunnel to an application on another machine. A .NET API can manage profiling modes and capture snapshots; command-line tools can automate profiling and performance monitoring in continuous integration. That breadth is especially useful to teams incorporating profiling into repeatable workflows.
- Developer integrations and AI tooling: Plugins connect it to Microsoft Visual Studio and JetBrains Rider. The download page also describes a built-in MCP server for connecting tools such as Claude Desktop, Codex, or OpenCode to analyze profiler snapshots.
- Runtime coverage: Version 2026.9 supports .NET 5 through .NET 10 and .NET Framework 4.x, with profiling downloads for Linux, macOS, and Windows architectures.
Pricing
A 15-day trial and a free license option sit alongside paid seats and floating licenses. The free license is for open-source project contributors and Microsoft MVPs; it is not presented as a general free tier. Paid licenses are multi-platform and allow profiling any number of .NET applications simultaneously, so the key distinction is who needs access rather than how many applications are profiled.
- Seat licenses: The annual single-seat plan is $99/€99 per year; the perpetual single-seat plan is $129/€129 once. Both include one year of support and upgrades, and the seat can transfer between machines and developers. Five-seat versions cost $299/€299 per year or $389/€389 once. These fit individuals or teams that can work with transferable seats.
- Floating licenses: Single-user plans cost $499/€499 per year or $649/€649 once; five-user plans cost $1,499/€1,499 per year or $1,949/€1,949 once. They include one year of support and upgrades plus centralized license management. The higher price makes them more appropriate where centralized control matters than for a small team content with transferable seats.
- Enterprise: Custom pricing for companies with more than 50 profiler installations. This is the relevant route for larger deployments, rather than buying individual seat bundles.
Annual subscriptions renew by year, while perpetual plans are one-time purchases that include only one year of support and upgrades. Active support includes unlimited-incident email help with installation, product use, and general questions.
Platforms
The product is a desktop deployment with profiling support for Linux, macOS, and Windows. The license is multi-platform, useful for teams working across operating systems rather than purchasing separate platform-specific licenses.
Who it's for
YourKit is a strong fit for .NET developers and teams that need CPU, memory, and thread analysis, particularly when work spans remote systems or benefits from CI automation. IDE integrations and request-level diagnostics make it practical in development as well as production. It is less suitable for readers seeking a broadly language-agnostic profiler or a generally available free edition.
Pros and cons
- Pro: CPU and memory analysis, thread profiling, and more than 20 inspections address a wide range of .NET performance investigations.
- Pro: SSH-tunneled remote profiling and command-line/API automation support production and continuous-integration workflows.
- Pro: A multi-platform license covers any number of .NET applications simultaneously.
- Con: The free license is restricted to open-source project contributors and Microsoft MVPs, so most users will need a paid plan after the short trial.
- Con: Floating plans cost substantially more than seat licenses, making centralized management an expensive requirement for smaller teams.
Alternatives
For a broader comparison, see Profiling Software.
- Grafana Cloud Application Observability is worth considering for teams seeking a freemium observability service, with an always-free allowance of 2,232 host hours and a Pro option billed by host hour plus a monthly platform fee.
- Scalene is a free, open-source Python profiler installed via pip or conda; choose it when profiling Python rather than .NET.
- Javadoc is included with JDK 25, whose binaries are free under Oracle No-Fee Terms and Conditions through September 2028.
- Node.js --prof is a free option for generating V8 profiler output.
- Parca is a free alternative with components available under the Apache 2 License.
- py-spy is a free, MIT-licensed sampling profiler for Python programs.
- Pyroscope offers a free tier with 50 GB ingested per month and 14-day retention, alongside a paid Pro plan.
- Valgrind is a free alternative for Android, Linux, and macOS; its programs run significantly slower and use more memory.
Verdict
Choose YourKit .NET Profiler if your .NET work calls for detailed CPU and memory analysis plus remote access and automation in development or production. Its multi-platform licensing and broad diagnostic workflow are the main reasons to choose it. Look elsewhere if you need a general profiler for other languages, or if the restricted free license and paid seat costs do not fit your team.
Getting started
- Visit https://www.yourkit.com/dotnet-profiler/.
- Choose a profiling download for Linux, macOS, or Windows architecture.
- Use the 15-day trial, contact sales about an eligible free license, or select a paid license.
- Connect the profiler to a local application or use remote profiling tools to create an SSH tunnel.
- Optionally install the Visual Studio or JetBrains Rider plugin, or use the API and command-line tools for profiling automation.
Limits worth knowing
The trial lasts 15 days. The free license is for open source project contributors and Microsoft MVPs; paid annual single-seat licensing starts at $99 a year, and the Enterprise plan is for companies with more than 50 profiler installations.
Questions
What does YourKit .NET Profiler analyze?
It profiles CPU performance and memory in .NET and .NET Core applications. CPU results include call trees and hot spots, and memory tools show the object heap and object graph.
Which platforms and runtimes are supported?
Version 2026.9 supports .NET 5 through .NET 10 and .NET Framework 4.x, with downloads for Linux, macOS, and Windows architectures.
Is there a free option?
A free license is available for open source project contributors and Microsoft MVPs. The listed plan says to contact sales regarding a free license.
How much does a seat license cost?
A single-seat annual subscription costs $99 a year. A single-seat perpetual license costs $129, paid once.
Can a license profile multiple applications?
A purchased license is multi-platform and permits profiling any number of .NET applications simultaneously.
Who makes YourKit .NET Profiler?
YourKit GmbH lists its headquarters in Düsseldorf, Germany.
Alternatives to YourKit .NET Profiler
- 1
Grafana Cloud Application Observability
Free planAndroidiOSWebAPI8.4From $0.03 a month - 2
Grafana Alerting
Free planWebLinuxmacOSWindows6.8$0.03 usage-based - 3

Amazon CodeGuru Profiler
Free planWebAPILinuxSelf-hosted6.7From $0.01 a month - 4
Pyroscope
Free planWebLinuxmacOSWindows6.7From $19 a month - 5

Parca
Free planWebAPILinuxSelf-hosted6.6Free plan - 6
Intel VTune Profiler
Free planLinuxSelf-hostedWindows6.5Free plan