Intel VTune Profiler
Intel VTune Profiler analyzes application and system performance to help developers locate bottlenecks across AI, HPC, cloud, IoT, media, and storage workloa…
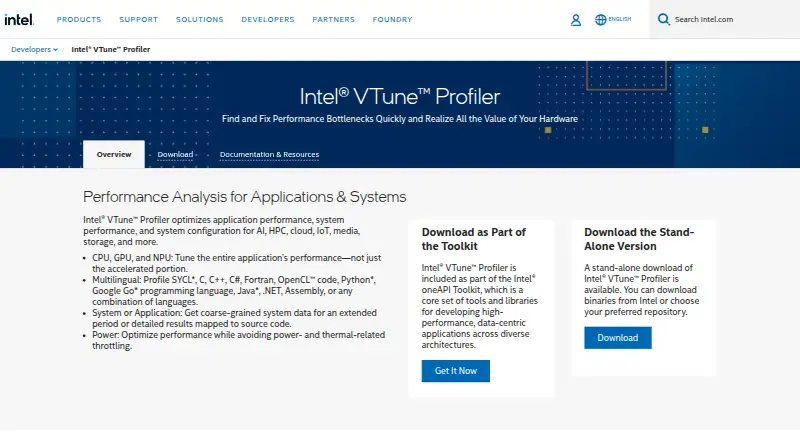
What Intel VTune Profiler is
Intel VTune Profiler analyzes application and system performance to help developers locate bottlenecks across AI, HPC, cloud, IoT, media, and storage workloads. It profiles CPUs, GPUs, and NPUs, including a unified XPU Offload Analysis view. Hotspot analysis identifies time-consuming code, and Flame Graphs visualize hot paths. Microarchitecture exploration and memory analysis can help identify hardware issues, cache misses, and bandwidth problems. Intel lists support for SYCL, C, C++, C#, Fortran, OpenCL, Python, Go, Java, .NET, and Assembly, including mixed-language applications. The profiler is available as a standalone download or through the oneAPI Toolkit, with integrations documented for Visual Studio and Eclipse. The listed 2026.4 release supports 64-bit Windows and Linux hosts. Its Linux-only AI Assistant can run collections, report analyses, and suggest optimizations using the user’s own LLM access; Intel cautions that suggestions may be inaccurate. Some analyses require administrator or root privileges.
Good
- Analyzes performance across CPUs, GPUs, and NPUs.
- Flame Graphs show time-consuming code paths.
- Memory analysis can identify cache misses and bandwidth problems.
- Supports a broad range of programming languages.
- Available as a standalone download or in oneAPI Toolkit.
Watch out
- Some analyses require administrator or root privileges.
- AI Assistant is limited to Linux.
- AI Assistant recommendations may be inaccurate.
- Platform Profiler will receive no further feature or security fixes.
Who it suits
VTune Profiler suits developers and performance specialists working with applications or systems on Windows or Linux. It is relevant to teams profiling code in its supported languages across CPU, GPU, or NPU workloads.
Verdict
VTune Profiler offers workload analysis across multiple processor types and supports a wide range of languages. Users should account for privileged access requirements and the stated limits of the AI Assistant and Platform Profiler.
Plans and prices
From Intel VTune Profiler's own pricing page, checked 20 Sep 2026.
| Plan | Price | What it gives you |
|---|---|---|
| Free download | Free | Available as a standalone tool or through the Intel oneAPI Toolkit · Commercial and non-commercial use permitted · Community support available |
| Intel VTune Profiler | Free | Latest release publicly available · Older versions require purchased Priority Support · Free download; Intel says oneAPI Toolkit components require no license for download, installation, or use. |
The facts
Each one read from Intel VTune Profiler's own pages, with the date it was checked.
What it does
- AI assistant
- The 2026.4 Linux-only AI Assistant can run collections, report analyses, and suggest bottleneck optimizations using the user’s own LLM access; Intel cautions that its recommendations may be inaccurate.checked 29 Sep 2026
- CPU, GPU, and NPU
- It provides performance analysis across CPUs, GPUs, and NPUs, including a unified XPU Offload Analysis view.checked 29 Sep 2026
- Current release
- Intel’s release notes list VTune Profiler 2026.4, released August 6, 2026, and state that it supports 64-bit host operating systems on Windows and Linux.checked 29 Sep 2026
- Distribution
- VTune Profiler is available as a standalone download or as part of the Intel oneAPI Toolkit.checked 29 Sep 2026
- Hotspots
- The profiler locates time-consuming code hotspots and visualizes hot code paths with Flame Graphs.checked 29 Sep 2026
- Integrations
- Intel documents integrations with Microsoft Visual Studio and Eclipse; Linux installation also offers an Eclipse integration option.checked 29 Sep 2026
- Language support
- Intel lists support for profiling SYCL, C, C++, C#, Fortran, OpenCL, Python, Go, Java, .NET, and Assembly code, including mixed-language applications.checked 29 Sep 2026
- Memory analysis
- Microarchitecture exploration identifies hardware performance issues, while memory analysis can pinpoint cache misses and bandwidth problems.checked 29 Sep 2026
- Notable limitation
- Intel states that Platform Profiler reached its final release in VTune 2025.0 and will receive no further feature improvements or security fixes.checked 29 Sep 2026
- Purpose
- VTune Profiler analyzes application and system performance to help find bottlenecks across AI, HPC, cloud, IoT, media, and storage workloads.checked 29 Sep 2026
- Security
- Some analyses require administrator or root privileges, and Intel advises limiting access to the Linux sampling driver because collected system metrics may expose sensitive information.checked 29 Sep 2026
- Server security
- Intel says VTune Profiler Server network traffic is encrypted and recommends choosing an appropriate authentication scheme for the deployment.checked 29 Sep 2026
- Support
- Intel directs users to product documentation, forums, and support resources; active oneAPI Priority Support customers can open a support ticket for the toolkit.checked 29 Sep 2026
Money
- Free plan
- Yeschecked 20 Sep 2026
The full review of Intel VTune Profiler
Intel VTune Profiler is a desktop tool for analyzing application and system performance across processor types. It is best suited to developers tracing bottlenecks in demanding or mixed-language workloads. Its broad profiling scope is compelling at no cost, though some analyses require elevated privileges.
Overview
VTune covers AI, HPC, cloud, IoT, media, and storage workloads, with analysis spanning CPUs, GPUs, and NPUs. Its unified XPU Offload Analysis view helps examine work that crosses those processor types. That breadth makes it a useful choice for performance diagnosis; it is not a substitute for a graphics-card tuning or overclocking utility.
The 2026.4 release supports 64-bit Windows and Linux hosts. VTune is available as a standalone download or through the Intel oneAPI Toolkit, whose components require no license for download, installation, or use. It integrates with Microsoft Visual Studio and Eclipse, which can fit into existing development workflows.
Key features
Code hotspots and hardware behavior
VTune identifies time-consuming code hotspots and uses Flame Graphs to visualize hot paths. Microarchitecture exploration can help diagnose hardware performance issues, while memory analysis can pinpoint cache misses and bandwidth problems. These tools are most valuable when a developer needs to connect slow execution to code paths and memory behavior rather than just observe that an application is slow.
Languages and AI assistance
Supported languages include SYCL, C, C++, C#, Fortran, OpenCL, Python, Go, Java, .NET, and Assembly, including mixed-language applications. That range suits teams working across varied codebases. The Linux-only AI Assistant in release 2026.4 can run collections, report analyses, and suggest optimizations using the user's own LLM access. Intel warns that its recommendations may be inaccurate, so it should inform investigation rather than be treated as authoritative advice.
Access and security
Some analyses require administrator or root privileges, a practical constraint in managed environments or on shared systems. Intel advises restricting access to the Linux sampling driver because collected system metrics may expose sensitive information. For VTune Profiler Server, network traffic is encrypted, and Intel recommends selecting an authentication scheme appropriate to the deployment.
Pricing
VTune is free, not a time-limited trial. The Free download plan costs nothing and is available standalone or through the oneAPI Toolkit; commercial and non-commercial use is permitted, with community support. It fits individuals and teams wanting the current tool without a purchase commitment.
The Intel VTune Profiler plan also costs nothing, billed as a free download. The latest release is publicly available, while older versions require purchased Priority Support. Active oneAPI Priority Support customers can open toolkit support tickets; Intel also directs users to documentation, forums, and support resources. The free offer is broad, but access to older releases carries a support-related condition.
Platforms
VTune is available for Windows and Linux 64-bit hosts, with Linux, Windows, and self-hosted deployment listed. It is a desktop profiler, and profiling modes include both. Linux users have the additional AI Assistant option, while its elevated-privilege requirements for some analyses may complicate use where users cannot administer the system.
Who it's for
Choose VTune if you need to diagnose application or system bottlenecks across CPUs, GPUs, or NPUs, especially when memory behavior, hardware-level performance, or mixed-language code matters. It is less suitable if your aim is simply to adjust GPU clocks or settings, or if you cannot grant the access some analyses require.
Pros and cons
- Pros: CPU, GPU, and NPU analysis with a unified offload view helps address workloads spanning processor types.
- Pros: Hotspot, Flame Graph, microarchitecture, and memory tools connect code paths with hardware and bandwidth issues.
- Pros: Free use, broad language coverage, and Visual Studio and Eclipse integrations suit varied development setups.
- Cons: Some analyses need administrator or root privileges, which can block use on tightly controlled systems.
- Cons: The AI Assistant is Linux-only and its optimization suggestions may be inaccurate.
- Cons: Platform Profiler reached its final release in VTune 2025.0 and will receive no further feature improvements or security fixes.
Alternatives
For GPU tuning rather than code profiling, consider GPU Tuning Software. GPU Overclocking Software is a closer fit when changing graphics-card clocks is the goal, while Game Graphics Optimization Software suits readers focused on game graphics settings and performance. For code and application analysis, browse Profiling Software; for diagnosing hardware issues, see Hardware Diagnostic Software. Readers seeking help updating drivers should look at Driver Updater Software.
ASUS GPU Tweak III is a free Windows alternative for GPU tuning. AMD GPU Tuner is a free, open-source Windows option for Radeon GPUs on Windows 10 or 11 (64-bit) with a compatible Adrenalin driver. Linux users wanting NVIDIA overclocking should consider NVIDIA_OC Daemon, distributed under the MIT License; CoreCtrl is another free and open-source GNU/Linux application. LACT is a Linux GPU configuration and monitoring tool. For newer AMD graphics cards, MoreClockTool is a free Windows option intended for experienced users and evaluation, with use and overclocking at the user's own risk. TuxClocker is a GNU/Linux alternative with hardware-specific GPU and CPU support. Green Curve is a free option for Linux and Windows.
Verdict
VTune Profiler is the right choice for developers who need detailed, free performance analysis across processor types and varied languages. Its analysis breadth is the main reason to choose it; look elsewhere if you need direct GPU tuning, cannot obtain required privileges, or need ongoing development of Platform Profiler.
Alternatives to Intel VTune Profiler
- 1
MemTest86
Free planLinuxmacOSSelf-hostedWindows7.5From $76 a year - 2
HCI MemTest
Free planLinuxWindows7.3$5 one-time - 3
CoreCtrl
Free planOpen sourceLinux7.1Free plan - 4
AIDA64
AndroidiOSWindows7.0€59.95 one-time - 5

ASUS GPU Tweak III
Free planWindows6.7Free plan - 6

OCCT
Free planLinuxWindows6.6Free plan