
Mind the Graph
Mind the Graph is a web-based tool for making science figures, graphical abstracts, infographics, posters, and presentations for research and education.
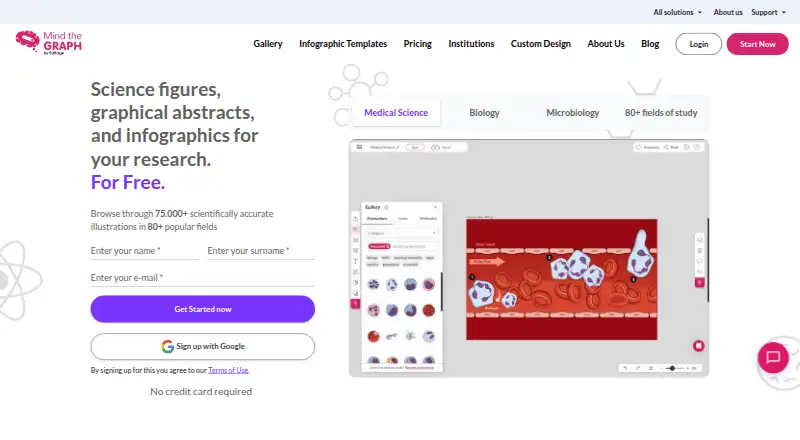
What Mind the Graph is
Mind the Graph is a web-based tool for making science figures, graphical abstracts, infographics, posters, and presentations for research and education. Its editor lets users customize illustrations, text, shapes, colors, and other template elements. The service advertises more than 75,000 scientifically accurate illustrations across 80+ fields and more than 300 templates. Creations can be downloaded as PNG, TIFF, or PDF files. The free Starter plan allows unlimited creations but restricts library access and caps users at four scientific illustrations. Free users must keep the Mind the Graph watermark and cite the platform in formal communications, publications, lectures, and presentations. Paid options include Researcher at $9 a month billed yearly, with a monthly option shown as $14/month; a Researcher bundle with three AI tools at $12 a month billed yearly; and Teams & Labs at $99 a month, shown for 10 or more simultaneous users. The pricing page states that the service is ISO/IEC 27001:2013 certified. Mind the Graph became part of Cactus Communications in 2022 and is offered under CACTUS’s Editage brand.
Good
- More than 75,000 illustrations across 80+ fields
- 300+ templates for scientific visuals
- PNG, TIFF, and PDF downloads
- Free plan and paid options for teams
Watch out
- Starter limits users to four scientific illustrations
- Free access to the illustration library is restricted
- Free work requires a watermark and citation
Who it suits
Mind the Graph suits scientists, academics, and healthcare professionals who need to communicate complex scientific content visually. Its templates, illustration library, and team plan may also suit research groups making shared materials.
Verdict
Mind the Graph focuses on creating and exporting research visuals using templates and a large science illustration library. Free users should account for the illustration limit, restricted library access, watermark, and citation requirement.
Plans and prices
From Mind the Graph's own pricing page, checked 15 Oct 2026.
| Plan | Price | What it gives you |
|---|---|---|
| Starter | Free | Unlimited creations · up to 4 scientific illustrations · restricted library access · graphical abstracts, infographics and posters |
| Researcher + 3 AI tools | $12 a month | Researcher features · academic writing assistant · literature search · journal finder · $12/month billed yearly |
| Mind the Graph Researcher + 3 AI tools | $12 a month | Researcher plan · Academic writing assistant · Literature search · Journal finder · $144 billed yearly |
| Researcher | $14 a month | 75,000+ illustrations · customizable artwork · templates · unlimited AI image generation · custom illustrations · unlimited vector downloads · unlimited collaborators · priority support · $14/month |
| Teams & Labs | $99 a month | Team content sharing · 10 simultaneous users or more · 50 custom illustration requests monthly · Unlimited creations and scientific illustrations · 99 USD MONTHLY; shown for 10 simultaneous users or more |
| Researcher | $99 a year | 75,000+ illustrations · customizable artwork · templates · unlimited AI image generation · custom illustrations · unlimited vector downloads · unlimited collaborators · priority support · $99 billed yearly |
| Researcher + 3 AI tools | $144 a year | Researcher features · academic writing assistant · literature search · journal finder · $144 billed yearly |
The facts
Each one read from Mind the Graph's own pages, with the date it was checked.
What it does
- AI poster tool
- Researcher.Life describes an AI-powered poster tool that can compose a poster from a published paper or conference abstract.checked 15 Oct 2026
- API and SDK documentation
- The official help center categories cover tutorials, legal information, billing and account support, but do not list a public Mind the Graph API or SDK section.checked 15 Oct 2026
- Charts and molecules
- The help center includes tutorials for charts and molecule elements in the editor.checked 15 Oct 2026
- Collaboration
- The benefits page describes team collaboration with up to 10 members working on projects simultaneously.checked 15 Oct 2026
- Crunchbase profile
- Crunchbase lists Mind The Graph as an active private company, founded in 2016, with founders Fabricio Pamplona and Leonardo Minozzo and four recorded funding rounds whose amounts are obscured.checked 15 Oct 2026
- Custom illustration confidentiality
- The features page states that custom-made illustrations are handled with 100% confidentiality.checked 7 Oct 2026
- Custom illustrations
- Paid subscriptions include an on-demand illustration service, with individual requests delivered within up to seven days.checked 15 Oct 2026
- Drag-and-drop editor
- The product combines a familiar drag-and-drop workspace with a scientific illustration library.checked 15 Oct 2026
- Editor
- The editor lets users customize illustrations, text, shapes, colors, and other template elements.checked 7 Oct 2026
- Export formats
- Official materials state that paid subscriptions provide high-resolution PNG, PDF and TIFF downloads.checked 15 Oct 2026
- Hosting model
- CACTUS terms classify Mind the Graph as a SaaS platform for academic infographics.checked 15 Oct 2026
- Illustration customization
- Users can change illustration colors, artwork styles, backgrounds and versions through documented workspace tools.checked 15 Oct 2026
- Illustration library
- The home page advertises more than 75,000 scientifically accurate illustrations covering over 80 fields.checked 15 Oct 2026
- Image uploads
- Users can upload images from their device through the workspace Library and Uploads sections.checked 15 Oct 2026
- Independent documentation
- A Japanese university guide documents workspace functions including templates, uploads, charts, molecules, sharing, comments, history and downloads.checked 15 Oct 2026
- Independent institutional access
- A Turkish university announcement describes temporary institutional access through March 31, 2026 and lists 75,000-plus illustrations, drag-and-drop creation and PNG/PDF/TIFF exports.checked 15 Oct 2026
- Independent listing
- Product Hunt shows Mind the Graph launches dated May 19, 2017 and April 1, 2019, but reports no user reviews.checked 15 Oct 2026
- Independent praise: integration
- LabCollector describes direct access to Mind the Graph Poster Maker from its ELN and LIMS environment.checked 15 Oct 2026
- Independent praise: usability
- Researcher.Life praises the intuitive drag-and-drop workflow, scientifically accurate illustrations, templates and publication-oriented formats.checked 15 Oct 2026
- Integration: LabCollector
- LabCollector users can open Mind the Graph Poster Maker directly from the ELN add-on, with the platform integrated into LabCollector LIMS.checked 15 Oct 2026
The company
- Company profile
- LinkedIn lists Mind the Graph as a privately held software-development company founded in 2016 with 11–50 employees and headquarters in Singapore.checked 15 Oct 2026
- Founded
- 2016checked 28 Sep 2026
Money
- Free plan limitation
- The Starter plan allows up to four scientific illustrations and has restricted access to the illustration library.checked 7 Oct 2026
- Free-use licensing
- Free users must retain the Mind the Graph watermark and cite the platform in formal communication, publications, lectures, and presentations.checked 7 Oct 2026
Alternatives to Mind the Graph
- 1

Visme
Free planAndroidiOSWebAPI8.4From $12.25 a month - 2

Infogram
Free planAndroidiOSWebAPI8.1From $19 a month - 3
MilleMots
Free planAndroidiOS7.6From $49.99 a year - 4

Piktochart
Free planWeb7.5From $39 a year - 5

GetInfographic
Free planWebAPIExtension7.4From $9 a month - 6

Jeda.ai
Free planWeb6.9From $8.33 a month