
Forsta Visualizations
Forsta Visualizations turns survey data into interactive dashboards, infographics, and reports, including reports in native PowerPoint format.
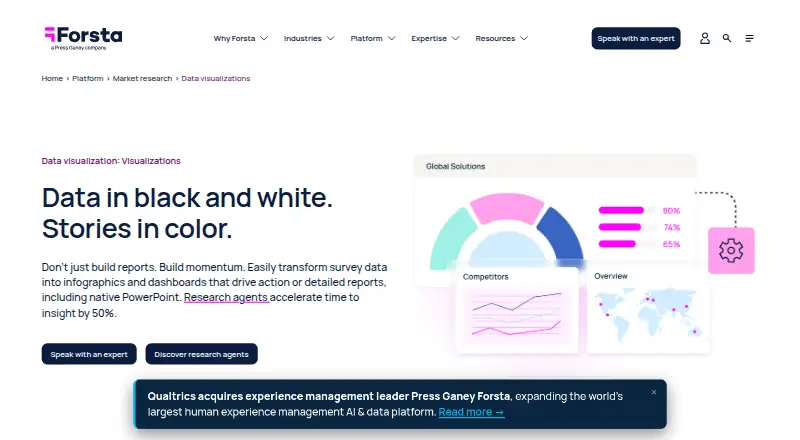
What Forsta Visualizations is
Forsta Visualizations turns survey data into interactive dashboards, infographics, and reports, including reports in native PowerPoint format. Market researchers can build reports with a free-form drag-and-drop interface, without coding, and export them to PowerPoint, Excel, PDF, and other formats. Recurring reports can be automated, and online dashboards can refresh when new data arrives. Analysis tools include crosstabs, significance tests, time-series analysis, and rim or target weighting. Forsta also says its AI tools can summarize open-ended answers, examine sentiment and topics, and assist with report creation. Data can connect through APIs to some survey systems or arrive as SPSS, Triple-S, Excel, or CSV files. Reports can be tailored to stakeholders using smart filters, dynamic branding, and automatic versioning. The service is available on the web and through an API. Forsta lists TLS, approved PCI DSS-compliant hosting providers, and 99.6% annual guaranteed uptime excluding planned maintenance; customer databases are backed up daily and backups are kept for 60 days. Pricing is on request, with permissions and features depending on the negotiated license.
Good
- Build reports with drag-and-drop, without coding.
- Automate recurring reports and refreshing dashboards.
- Exports include PowerPoint, Excel, and PDF.
- Includes crosstabs and significance tests.
- Onboarding, training, templates, and support are provided.
Watch out
- Pricing is available only on request.
- Permissions and features depend on the negotiated license.
- Clients are responsible for checking supplied data accuracy.
Who it suits
It is designed for market researchers preparing research findings for stakeholders. Teams that need recurring reports, branded access, and survey analysis tools may find its feature set relevant.
Verdict
Forsta Visualizations combines survey analysis, automated reporting, and stakeholder-oriented publishing in one product. Buyers should confirm the license scope and ensure their team can validate the accuracy and completeness of incoming data.
Plans and prices
From Forsta Visualizations's own pricing page, checked 9 Oct 2026.
| Plan | Price | What it gives you |
|---|---|---|
| Forsta Visualizations | Priced on request | Pricing and fees are set in a negotiated, signed order document; user permissions and features depend on the license |
The facts
Each one read from Forsta Visualizations's own pages, with the date it was checked.
What it does
- Access controls
- Reports can be tailored for stakeholders with access controlled through smart filters, dynamic branding, and auto-versioning.checked 9 Oct 2026
- AI features
- Forsta says its AI tools can summarize open-ended responses, analyze sentiment and topics, and help generate reports.checked 9 Oct 2026
- Automation
- The product can automate recurring reports and create online dashboards that refresh with new data.checked 9 Oct 2026
- Backups
- The published Visualizations SLA says customer databases are backed up every 24 hours and backups are stored for 60 days.checked 9 Oct 2026
- Data import
- Forsta’s support terms say survey data can connect by API to some survey systems or be supplied as SPSS, Triple-S, Excel, or CSV files.checked 9 Oct 2026
- Data quality responsibility
- The Visualizations support terms assign clients responsibility for checking data accuracy and say Forsta does not check the accuracy or completeness of supplied data.checked 9 Oct 2026
- Exports
- Reports can be exported in native PowerPoint, Excel, PDF, and other formats.checked 9 Oct 2026
- Integrations
- The product page names live connections to Decipher and Forsta Plus and says it connects to other survey platforms.checked 9 Oct 2026
- Intended users
- Forsta describes the product as designed for market researchers and positions it for turning research data into stakeholder-ready insights.checked 9 Oct 2026
- Purpose
- Forsta Visualizations turns survey data into interactive dashboards, infographics, and reports, including native PowerPoint reports.checked 9 Oct 2026
- Report design
- Users can create reports with a free-form drag-and-drop interface without coding.checked 9 Oct 2026
- Research analysis
- Its market research tools include crosstabs, significance tests, time-series analysis, and rim or target weighting.checked 9 Oct 2026
- Security and availability
- Forsta’s published Visualizations SLA states that the service uses TLS, is hosted by approved providers described as PCI DSS compliant, and has 99.6% annual guaranteed uptime excluding planned maintenance.checked 9 Oct 2026
- Support and onboarding
- Forsta says customers receive onboarding, training, templates, and a support team.checked 9 Oct 2026
The company
- Founded
- 2021checked 28 Sep 2026
Alternatives to Forsta Visualizations
- 1

SurveyMonkey
AndroidiOSAPI7.2 - 2
Make Opinion Next
Free planWebAPI7.0Free plan - 3

Great Question
WebAPI6.5From $1,290 a year - 4

Prolific
Free planWebAPI6.4Free plan - 5
Nebu
AndroidiOSWeb6.3 - 66.3From $1.50 a month