Engineering Analytics
Engineering Analytics is a web platform for turning software delivery activity into dashboards, insights, narratives, and reports.
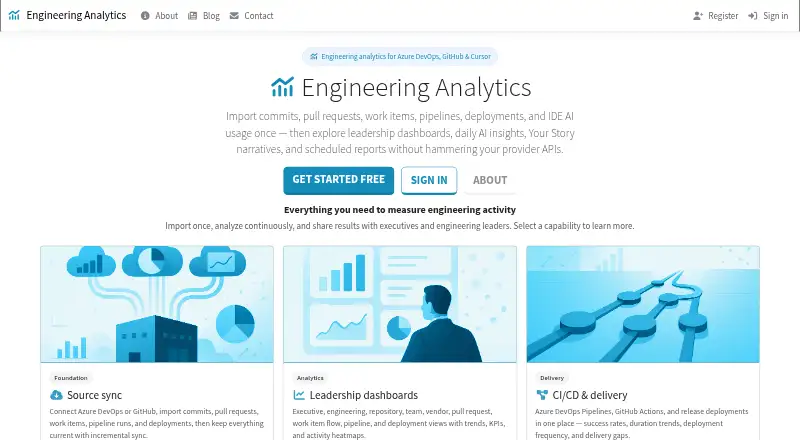
What Engineering Analytics is
Engineering Analytics is a web platform for turning software delivery activity into dashboards, insights, narratives, and reports. It imports commits, pull requests, work items, pipeline runs, deployments, and IDE AI usage from Azure DevOps and GitHub. Cursor team usage can be synchronized through the Cursor Admin API or CSV, with spend and activity grouped by developer and team. Dashboard areas include executive, engineering, repository, team, vendor, pull request, work item flow, pipeline, and deployment analytics, including DORA, delivery, and reliability metrics. An AI assistant answers natural-language questions from imported analytics, with administrator controls for named-developer questions and comparisons. The Free plan allows up to three repositories, 90 days of history, 150,000 AI tokens monthly, and HTML and CSV exports. Professional costs $649 a month per connected organization and adds unlimited repositories, full history, more exports, daily insights, and scheduled reports. Premium costs $899 a month and includes Your Story. SSO is supported.
Good
- Connects Azure DevOps and GitHub data
- Includes DORA, delivery, and reliability metrics
- Natural-language AI assistant
- Free plan supports up to three repositories
- Supports SSO
Watch out
- Free plan retains 90 days
- Professional costs $649 a month
- Premium costs $899 a month
- Not intended for employee surveillance
Who it suits
It suits engineering leaders measuring delivery across teams, vendors, repositories, pipelines, and IDE AI tools. The free tier is relevant for smaller repository counts, while paid plans add broader retention and reporting.
Verdict
Engineering Analytics provides a broad view of engineering delivery and reliability activity, with dashboards, AI questions, exports, and plan-based reporting features. Teams should match repository scale and history needs against the free and paid plan limits.
Plans and prices
From Engineering Analytics's own pricing page, checked 9 Oct 2026.
| Plan | Price | What it gives you |
|---|---|---|
| Professional | $649 a month | Unlimited repositories · Full history retention · 1,000,000 AI tokens / month · HTML, CSV, Excel, and PDF exports · Billed per connected organization |
| Premium | $899 a month | Unlimited repositories · Full history retention · 1,000,000 AI tokens / month · HTML, CSV, Excel, and PDF exports · Includes Your Story · Billed per connected organization |
| Free | — | Up to 3 repositories · 90 days of history retention · 150,000 AI tokens / month · HTML and CSV exports |
The facts
Each one read from Engineering Analytics's own pages, with the date it was checked.
What it does
- AI assistant
- The AI assistant answers natural-language questions using imported analytics, and administrators can control whether named-developer questions and comparisons are allowed.checked 9 Oct 2026
- Audience
- It is designed for engineering leaders to measure delivery activity across teams, vendors, repositories, CI/CD pipelines, and IDE AI tools.checked 9 Oct 2026
- Cursor integration
- Cursor team usage can be synchronized through the Cursor Admin API or CSV, with spend and activity rolled up by developer and team.checked 9 Oct 2026
- Daily insights
- Daily AI insights are available on the Professional plan and can appear on the homepage or be emailed to subscribers.checked 9 Oct 2026
- Dashboards
- Dashboard views cover executive, engineering, repository, team, vendor, pull request, work item flow, pipeline, and deployment analytics.checked 9 Oct 2026
- Delivery analytics
- It imports Azure DevOps Pipelines, classic builds, GitHub Actions workflow runs, and release deployments for delivery and reliability metrics.checked 9 Oct 2026
- Privacy and intended use
- The platform says it is not intended for employee surveillance, individual productivity scoring, time tracking, or raw Git statistics for performance management.checked 9 Oct 2026
- Purpose
- The platform turns commits, pull requests, work items, pipelines, deployments, and IDE AI usage into engineering dashboards, insights, narratives, and reports.checked 9 Oct 2026
- Reports
- Reports can be generated on demand or by email subscription, and scheduled subscriptions require the Professional plan.checked 9 Oct 2026
- Security
- The privacy policy says provider tokens and authentication secrets are encrypted before database storage and access to organization data requires authentication and active membership.checked 9 Oct 2026
- Source integrations
- It connects to Azure DevOps and GitHub to import commits, pull requests, work items, pipeline runs, and deployments.checked 9 Oct 2026
- Support
- The contact page accepts questions about integrations, analytics, licensing, and support through a contact form.checked 9 Oct 2026
- Your Story
- Your Story is available on Premium and creates AI-assisted journals, monthly chapters, quarterly seasons, and yearly chronicles from organization analytics.checked 9 Oct 2026
Alternatives to Engineering Analytics
- 1

Middleware
Free planAndroidiOSWebAPI8.2$0.30 usage-based - 2

Pluralsight
AndroidiOSWebAPI7.9From $299 a year - 3

DevDynamics
Free planWebAPILinuxmacOS7.8From $15 a month - 4

Allstacks
Free planWebAPI7.5From $200 a year - 5

Plandek
Free planWebAPISelf-hosted7.5From $2,555 a month - 6

Deviera
Free planWebAPISelf-hosted7.1From $25 a month