Prometheus Node Exporter
Prometheus Node Exporter exposes hardware and operating system metrics from *NIX kernels for Prometheus.
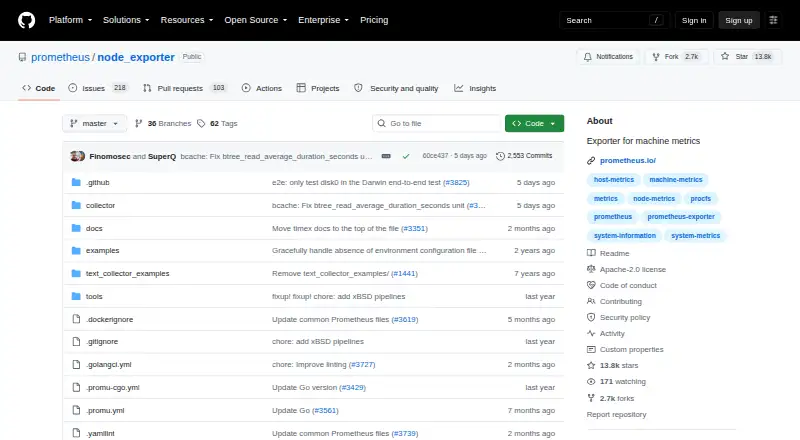
What Prometheus Node Exporter is
Prometheus Node Exporter exposes hardware and operating system metrics from *NIX kernels for Prometheus. It is written in Go and uses pluggable collectors. Default collectors cover CPU, disk I/O, filesystem, memory, and network metrics, although availability depends on the operating system. Collectors can be switched on or off with command-line flags, and some include filters for selecting or excluding data. The exporter listens on HTTP port 9100 by default. Installation guidance covers Linux distribution packages, a community Ansible role, and containers. Container-based host monitoring needs access to host namespaces and suitable mounts; some systems also need an extra capability for the timex collector. Certain collectors are disabled by default because they may use significant host resources, take longer to run, or produce high-cardinality data. The project recommends Windows Exporter for Windows users. Node Exporter is open source under the Apache 2 License, with no paid plans listed. The download page lists binaries for Darwin amd64, Darwin arm64, and Linux amd64.
Good
- Open source under the Apache 2 License.
- Default collectors cover CPU, disk, filesystem, memory, and network.
- Collectors can be enabled or disabled with flags.
- Listens on HTTP port 9100 by default.
- Installation guidance includes packages, Ansible, and containers.
Watch out
- Metric availability varies by operating system.
- Container monitoring needs host namespace access and mounts.
- Some systems need an extra capability for the timex collector.
- The project recommends a separate exporter for Windows.
Who it suits
Node Exporter suits users monitoring hardware and operating system metrics from *NIX hosts with Prometheus. Windows users are directed to Windows Exporter instead.
Verdict
Node Exporter offers configurable host-metric collection for Prometheus, with installation options for packages, Ansible, and containers. Check operating system support and container access requirements before deploying it.
Plans and prices
From Prometheus Node Exporter's own pricing page, checked 9 Oct 2026.
| Plan | Price | What it gives you |
|---|---|---|
| Free | Free | Apache 2.0 licensed software · no paid plans listed |
The facts
Each one read from Prometheus Node Exporter's own pages, with the date it was checked.
What it does
- Collectors
- It is written in Go and uses pluggable metric collectors.checked 9 Oct 2026
- Configuration
- Collectors can be enabled or disabled with command-line flags, and some support include or exclude filters.checked 9 Oct 2026
- Container deployment
- Containerized host monitoring requires host namespace access and appropriate mounts; the documentation also notes that some systems need an extra capability for the timex collector.checked 9 Oct 2026
- Endpoint
- Node Exporter listens on HTTP port 9100 by default.checked 9 Oct 2026
- Installation
- The project documents Linux distribution packages, an Ansible community role, and container deployment.checked 9 Oct 2026
- Integrations
- The Prometheus documentation lists Node Exporter as a guide for monitoring Linux host metrics.checked 9 Oct 2026
- License
- Prometheus components are available under the Apache 2 License.checked 9 Oct 2026
- Metrics
- Default collectors include CPU, disk I/O, filesystem, memory, and network metrics, with support varying by operating system.checked 9 Oct 2026
- Optional collectors
- Some collectors are disabled by default due to factors such as high cardinality, long runtime, or host resource demands.checked 9 Oct 2026
- Purpose
- Node Exporter exposes hardware and operating system metrics from *NIX kernels for Prometheus.checked 9 Oct 2026
- Security reporting
- The repository directs vulnerability reports to the Prometheus security policy.checked 9 Oct 2026
Where it runs
- Release platforms
- The download page lists Node Exporter binaries for Darwin amd64, Darwin arm64, and Linux amd64.checked 9 Oct 2026
- Windows support
- The project recommends Windows Exporter for Windows users.checked 9 Oct 2026
Alternatives to Prometheus Node Exporter
- 1

Checkmk
Free planOpen sourceAndroidiOSWebAPI8.8From $275 a month - 2
Netdata
Free planOpen sourceAndroidiOSWebAPI8.7From $4.50 a month - 3

Centreon
Free planOpen sourceWebAPILinuxSelf-hosted8.3From €2.27 a year - 4

ManageEngine OpManager
Free planAndroidiOSWebAPI8.3From $95 a year - 5
Telegraf
Free planOpen sourceWebAPILinuxmacOS8.3From $18,000 a year - 6

Nagios XI
Free planWebAPILinuxmacOS8.1$2,595 one-time