.NET Memory Profiler
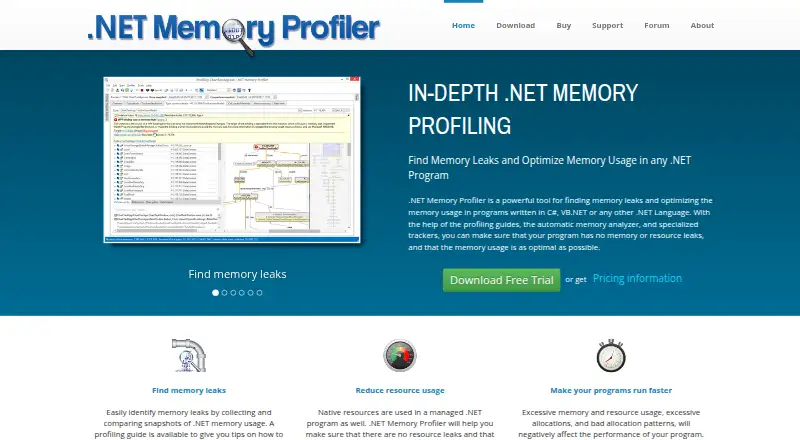
The facts below are what the maker publishes about .NET Memory Profiler, checked and dated. Our editors have not written about it yet.
Plans and prices
From .NET Memory Profiler's own pricing page, checked 9 Oct 2026.
| Plan | Price | What it gives you |
|---|---|---|
| .NET Memory Profiler 5.7 Standard | $189, paid once | Named-user license · Windows desktop · Standard edition features · Full License: US$ 189/€ 169 |
| .NET Memory Profiler 5.7 Professional | $389, paid once | Named-user license · Windows desktop · Professional edition features · Full License: US$ 389/€ 349 |
| .NET Memory Profiler 5.7 Enterprise | $549, paid once | Named-user license · Windows desktop · Enterprise edition features, including profiling child processes · Full License: US$ 549/€ 489 |
The facts
Each one read from .NET Memory Profiler's own pages, with the date it was checked.
What it does
- Automated testing
- Its API can control the profiler and detect potential memory leaks with assertions; the API is available as a NuGet package.checked 9 Oct 2026
- Compatibility
- The download page says the profiler runs on Windows 7, 8, 8.1, 10, 11, and specified Windows Server versions, and requires .NET Framework 4.5.2 or later.checked 9 Oct 2026
- Evaluation
- Without a registration key, the full version runs as a fully functional evaluation for seven non-consecutive days.checked 9 Oct 2026
- Integrations
- The product documents integration with Visual Studio and the DevExpress CodeRush test runner.checked 9 Oct 2026
- License and support
- Licenses are per named user, and the maker offers standard support and upgrades for three months with new and upgrade licenses.checked 9 Oct 2026
- Notable limitation
- The maker states that SQL Server profiling is not currently supported.checked 9 Oct 2026
- Production profiling
- It can attach to running processes, import memory dumps, and profile remote processes using the NmpCore tool.checked 9 Oct 2026
- Purpose
- .NET Memory Profiler helps find memory leaks and optimize memory usage in programs written in C#, VB.NET, or other .NET languages.checked 9 Oct 2026
- Security detail
- The features page says the .NET runtime attach API can collect snapshots faster and more securely; the maker pages reviewed do not state a security certification or compliance framework.checked 9 Oct 2026
- Snapshot analysis
- It collects and compares memory snapshots, with filters and an automatic analyzer that identifies more than 30 memory issues.checked 9 Oct 2026
- Support channels
- The maker offers online documentation, a discussion forum, and email support, and says it answers support requests within one business day.checked 9 Oct 2026
- Visual Studio
- Visual Studio integration supports starting profiling, opening saved sessions, and viewing memory details while debugging.checked 9 Oct 2026
The company
- Headquarters
- Järfälla, Swedenchecked 28 Sep 2026
Alternatives to .NET Memory Profiler
- 1
Grafana Cloud Application Observability
Free planAndroidiOSWebAPI8.4From $0.03 a month - 2
Grafana Alerting
Free planWebLinuxmacOSWindows6.8$0.03 usage-based - 3
YourKit .NET Profiler
Free planAPILinuxmacOSWindows6.8From $99 a year - 4

Amazon CodeGuru Profiler
Free planWebAPILinuxSelf-hosted6.7From $0.01 a month - 5
Pyroscope
Free planWebLinuxmacOSWindows6.7From $19 a month - 6

Parca
Free planWebAPILinuxSelf-hosted6.6Free plan