
LabPlot
LabPlot is free, open-source desktop software for visualizing and analyzing data on Linux, macOS, and Windows.
What LabPlot is
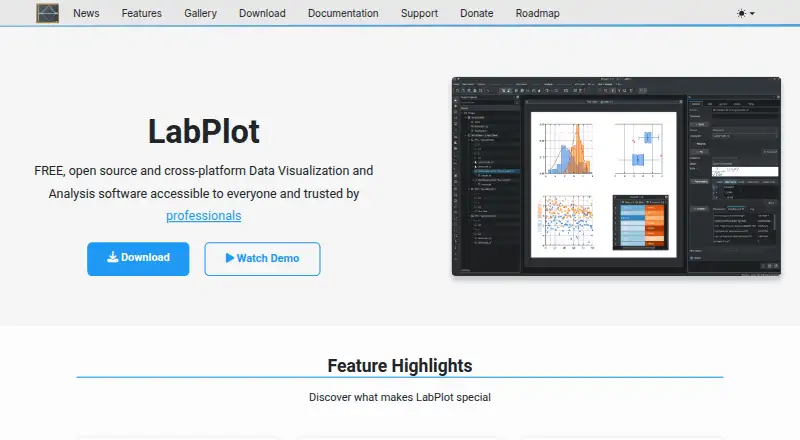
LabPlot is free, open-source desktop software for visualizing and analyzing data on Linux, macOS, and Windows. It creates interactive 2D plots such as scatter, line, histogram, box, bar, KDE, and control charts. Analysis tools cover statistics, linear and nonlinear regression, curve fitting, smoothing, interpolation, Fourier transforms, and signal processing. Interactive computational notebooks support Python, R, Julia, Maxima, Octave, and Lua. LabPlot imports data from CSV, Origin, SAS, Stata, SPSS, MATLAB, SQL, JSON, Excel, HDF5, MQTT, FITS, netCDF, ROOT, and other listed sources. It can read live data through Unix, UDP, and TCP sockets or a serial port. A plot digitizer extracts values from images through manual selection or semi-automated curve extraction. The project says the software runs locally and does not collect, transmit, or store user data. Packages are listed for major desktop systems, with additional FreeBSD and Haiku distributions.
Good
- Interactive publication-quality 2D plots
- Broad statistical and signal-processing tools
- Notebooks support Python, R, Julia, and more
- Reads live socket and serial data
- Runs locally without collecting user data
Watch out
- Desktop software rather than a web application
- No free trial is listed
- Setup spans many separate data-source formats
Who it suits
LabPlot suits engineers, students, and research scientists working with scientific data. It is also appropriate for users who want local desktop analysis, notebooks, and live data connections.
Verdict
LabPlot provides a broad local toolkit for plotting, analysis, notebooks, digitization, and live inputs without sending user data elsewhere. Its desktop focus makes it a strong fit for scientific workflows that need many formats and languages.
Plans and prices
From LabPlot's own pricing page, checked 11 Oct 2001.
| Plan | Price | What it gives you |
|---|---|---|
| LabPlot | Free | Free desktop software · open source |
The facts
Each one read from LabPlot's own pages, with the date it was checked.
What it does
- Analysis
- Analysis tools include statistics, linear and nonlinear regression, curve fitting, smoothing, interpolation, Fourier transforms, and signal processing.checked 11 Oct 2001
- Assessment
- The project offers a HECVAT v4.16 form and says cloud-infrastructure and SOC 2 questions may be not applicable to its local desktop software.checked 11 Oct 2001
- Audience
- The project describes LabPlot as serving users across scientific fields, including engineers, students, and research scientists.checked 11 Oct 2001
- Data formats
- It imports formats including CSV, Origin, SAS, Stata, SPSS, MATLAB, SQL, JSON, Excel, HDF5, MQTT, FITS, netCDF, and ROOT.checked 11 Oct 2001
- Data sources
- CSV,Origin,SAS,Stata,SPSS,MATLAB,SQL,JSON,binary,ODS,Excel,HDF5,MQTT,BLF,FITS,netCDF,ROOT,LTspice,Ngspice,MCAP,Kaggle datasets,Unix/UDP/TCP sockets,serial portschecked 20 Sep 2001
- Digitization
- The plot digitizer extracts data from images using manual point selection or semi-automated curve extraction.checked 11 Oct 2001
- Downloads
- The download page lists packages for Windows, macOS, and Linux, as well as FreeBSD and Haiku distributions.checked 11 Oct 2001
- Live data
- It can read live data through Unix, UDP, and TCP sockets and a serial port.checked 11 Oct 2001
- Notebooks
- Its interactive computational notebooks support languages and systems including Python, R, Julia, Maxima, Octave, and Lua.checked 11 Oct 2001
- Organization
- LabPlot is an open-source project under the KDE umbrella, supported by KDE e.V., a registered nonprofit in Germany.checked 11 Oct 2001
- Plots
- It supports interactive, publication-quality 2D plots, including scatter, line, histogram, box, bar, KDE, and control charts.checked 11 Oct 2001
- Purpose
- LabPlot is free, open-source software for data visualization and analysis.checked 11 Oct 2001
- Scheduled refresh
- Yeschecked 20 Sep 2001
- Security and privacy
- The project says LabPlot runs locally and does not collect, transmit, or store user data.checked 11 Oct 2001
- Support
- Users can report bugs through KDE Bugtracking or the app, ask questions on KDE Discuss or Matrix, and contact the support team by email.checked 11 Oct 2001
Money
- Free plan
- Yeschecked 20 Sep 2001
Where it runs
- Platform
- desktopchecked 20 Sep 2001
Alternatives to LabPlot
- 1

Datawrapper
Free planOpen sourceAndroidiOSWebAPI9.3From $21 a month - 2

Infogram
Free planAndroidiOSWebAPI8.8Free plan - 3

Klipfolio
AndroidiOSWebAPI8.3From $120 a month - 4
AnyChart
Free planAndroidiOSWebAPI8.0From $41.58 a month - 5
StatSilk
Free planAndroidiOSWebAPI8.0From $41.25 a month - 6

Kibana
Free planWeb7.8From $99 a month