
JProfiler
JProfiler analyzes JVM data to help identify performance bottlenecks, memory leaks, slow JDBC queries, and costly HTTP calls.
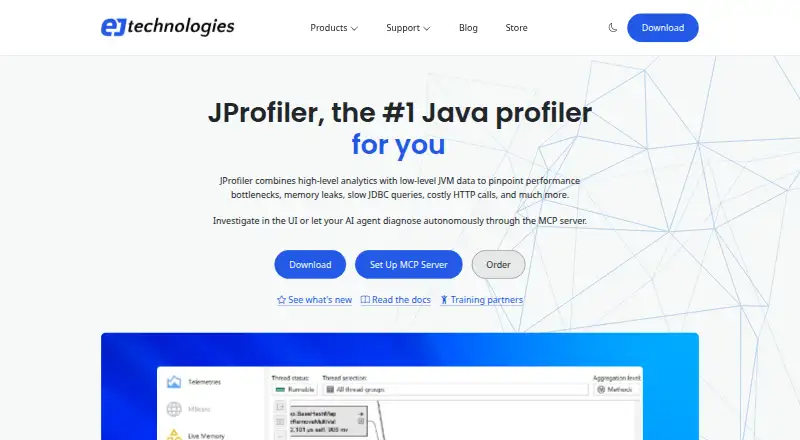
What JProfiler is
JProfiler analyzes JVM data to help identify performance bottlenecks, memory leaks, slow JDBC queries, and costly HTTP calls. Its profiling tools cover CPU, memory, heaps, threads, and garbage collection. High-level probes support JDBC, JPA, MongoDB, and Kafka operations, while HTTP profiling covers incoming and outgoing calls and the product supports Spring and JEE components. Users can compare snapshots, inspect JFR recordings, and automate offline recording with triggers or an API. JProfiler documents integrations with IntelliJ IDEA, Eclipse, NetBeans, and VS Code, and supports profiling JVMs in Kubernetes and Docker. It can connect to remote JVMs over SSH without remote installation or agent deployment. The product runs on the user's infrastructure and does not send profiling data to ej-technologies or third parties, though cloud AI agents may transmit retrieved data to their provider. The listed single license is $549, paid once and is perpetual. A free evaluation license is available with limitations; the Linux installer and UI require JDK 25.
Good
- Profiles CPU, memory, threads, and garbage collection
- Supports Kubernetes and Docker JVM profiling
- Connects to remote JVMs without remote installation
- Perpetual single license is listed
Watch out
- No free plan
- Single license costs $549, paid once
- Linux installer and UI require JDK 25
Who it suits
JProfiler suits developers who need to investigate JVM performance, memory, thread, database, or HTTP behavior. It may also fit teams profiling remote or containerized JVMs and using supported IDEs.
Verdict
JProfiler covers a wide range of JVM profiling tasks, including databases, HTTP calls, recordings, and remote or containerized JVMs. It is paid software with a limited evaluation license, and Linux users need JDK 25 for installation and UI use.
Plans and prices
From JProfiler's own pricing page, checked 30 Sep 2026.
| Plan | Price | What it gives you |
|---|---|---|
| JProfiler | $549, paid once | Single license · perpetual |
| JProfiler with 1 yr Support and Upgrades | $768, paid once | Single license · perpetual · includes 1 year of support and upgrades |
| JProfiler Floating License | $2,199, paid once | Floating license · concurrent use limited by number of licenses |
| JProfiler Floating License with 1 yr Support and Upgrades | $3,078, paid once | Floating license · concurrent use limited by number of licenses · includes 1 year of support and upgrades |
The facts
Each one read from JProfiler's own pages, with the date it was checked.
What it does
- AI integration
- A local MCP server exposes profiling data to configured AI coding agents, and the AI probe captures application calls to LLM frameworks including LangChain4j and Spring AI.checked 30 Sep 2026
- Containers and remote use
- The product supports profiling JVMs in Kubernetes and Docker and can connect to remote JVMs using SSH credentials without remote installation or agent deployment.checked 30 Sep 2026
- CPU and memory
- Features include CPU profiling, memory profiling, heap analysis, thread profiling, and garbage collection analysis.checked 30 Sep 2026
- Database and messaging
- JProfiler provides high-level probes for JDBC, JPA, MongoDB, and Kafka operations.checked 30 Sep 2026
- Data handling
- JProfiler runs on the user's infrastructure and does not send profiling data to ej-technologies or third parties, though cloud AI agents may send retrieved profiling data to their provider.checked 30 Sep 2026
- Download requirements
- The current download page lists Windows, macOS, and Linux packages; its Linux installer and UI require JDK 25.checked 30 Sep 2026
- HTTP and frameworks
- It profiles incoming and outgoing HTTP calls and provides support for Spring and JEE components.checked 30 Sep 2026
- IDE integrations
- The maker documents integrations for IntelliJ IDEA, Eclipse, NetBeans, and VS Code.checked 30 Sep 2026
- Licensing
- Licenses are perpetual; upgrades are free for minor releases, while major upgrades are free when released during the applicable support period.checked 30 Sep 2026
- Purpose
- JProfiler analyzes JVM data to identify performance bottlenecks, memory leaks, slow JDBC queries, and costly HTTP calls.checked 30 Sep 2026
- Snapshots and recordings
- Users can compare snapshots, analyze JFR recordings, and automate offline recording with triggers or an API.checked 30 Sep 2026
- Support
- The support request page says to allow up to 24 hours for a response and directs how-to questions to the Stack Overflow community.checked 30 Sep 2026
The company
- Company
- ej-technologies GmbH gives its address as Munich, Germany, and says it has developed performance and deployment tools since 2001.checked 30 Sep 2026
- Founded
- 2001checked 28 Sep 2026
- Headquarters
- Munich, Germanychecked 28 Sep 2026
Money
- Trial
- The software can be used with a free evaluation license, which is limited in some way by timeouts, restricted use, or evaluation warnings.checked 30 Sep 2026
Alternatives to JProfiler
- 1
Grafana Cloud Application Observability
Free planAndroidiOSWebAPI8.4From $0.03 a month - 2
Grafana Alerting
Free planWebLinuxmacOSWindows6.8$0.03 usage-based - 3
YourKit .NET Profiler
Free planAPILinuxmacOSWindows6.8From $99 a year - 4

Amazon CodeGuru Profiler
Free planWebAPILinuxSelf-hosted6.7From $0.01 a month - 5
Pyroscope
Free planWebLinuxmacOSWindows6.7From $19 a month - 6

Parca
Free planWebAPILinuxSelf-hosted6.6Free plan