iheatmapr
The facts below are what the maker publishes about iheatmapr, checked and dated. Our editors have not written about it yet.
Plans and prices
From iheatmapr's own pricing page, checked 11 Oct 2026.
| Plan | Price | What it gives you |
|---|---|---|
| iheatmapr | Free | R package · MIT license |
The facts
Each one read from iheatmapr's own pages, with the date it was checked.
What it does
- Annotations
- Row and column annotations can display data such as groups or continuous values alongside a heatmap.checked 11 Oct 2026
- Audience
- The package is designed for people working in R who want to create complex interactive heatmaps.checked 11 Oct 2026
- Clustering
- The package supports hierarchical clustering, k-means clustering, supplied group assignments, and dendrograms.checked 11 Oct 2026
- Complex layouts
- Users can add subplots to the top, bottom, left, or right of a heatmap and combine multiple heatmaps.checked 11 Oct 2026
- Dashboard type
- interactivechecked 23 Sep 2026
- Embedded dashboards
- Nochecked 23 Sep 2026
- Export
- Plots can be saved as standalone HTML or static PDF, PNG, or JPEG files.checked 11 Oct 2026
- Installation
- The package can be installed from CRAN with install.packages("iheatmapr") or from GitHub with devtools::install_github("ropensci/iheatmapr").checked 11 Oct 2026
- Integration
- iheatmapr uses the Plotly library and includes the Plotly.js open source library.checked 11 Oct 2026
- Interactivity
- It uses Plotly for cell tooltips and interactive zooming.checked 11 Oct 2026
- Layout
- Subplots can be added to the top, bottom, left, or right of a main heatmap, and multiple main heatmaps can show different data for the same conditions.checked 11 Oct 2026
- License
- The package is distributed under the MIT license.checked 11 Oct 2026
- Limit
- The convenience iheatmap function offers fewer options and less flexibility in component ordering and sizing than using modular functions directly.checked 11 Oct 2026
- Linked zoom
- Plots aligned with a main heatmap share its axis, so zooming in that axis is linked across the aligned plots.checked 11 Oct 2026
- Purpose
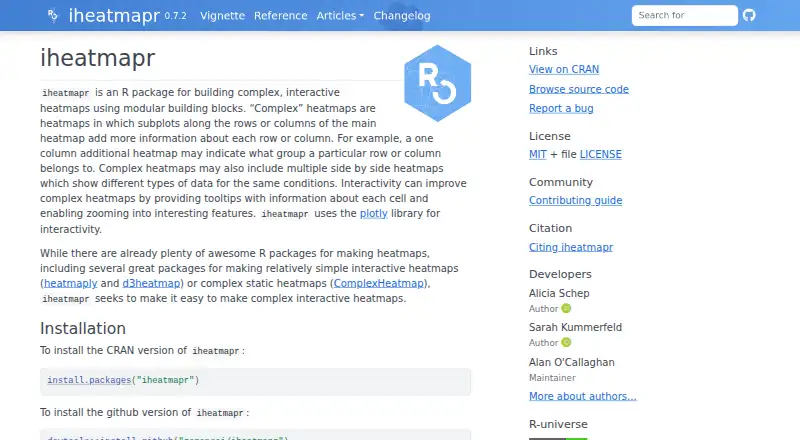
- iheatmapr is an R package for building complex, interactive heatmaps from modular building blocks.checked 11 Oct 2026
- Requirements
- CRAN lists R version 3.5.0 or later as a dependency.checked 11 Oct 2026
- Scheduled refresh
- Nochecked 23 Sep 2026
- Summaries
- Heatmap rows or columns can include summaries using functions such as mean, median, standard deviation, maximum, minimum, or sum.checked 11 Oct 2026
- Summaries and plots
- Users can add row or column summaries, barplots, line plots, and arbitrary subplots.checked 11 Oct 2026
- Support
- The project directs users to GitHub to report bugs.checked 11 Oct 2026
Money
- Free plan
- Yeschecked 23 Sep 2026
Where it runs
- Platform
- desktopchecked 23 Sep 2026
- Platform binaries
- CRAN lists Windows binaries and macOS binaries for arm64 and x86_64; the package page also provides a source archive.checked 11 Oct 2026