Google Charts
Google Charts provides chart types for visualizing data on websites, from line charts to hierarchical treemaps.
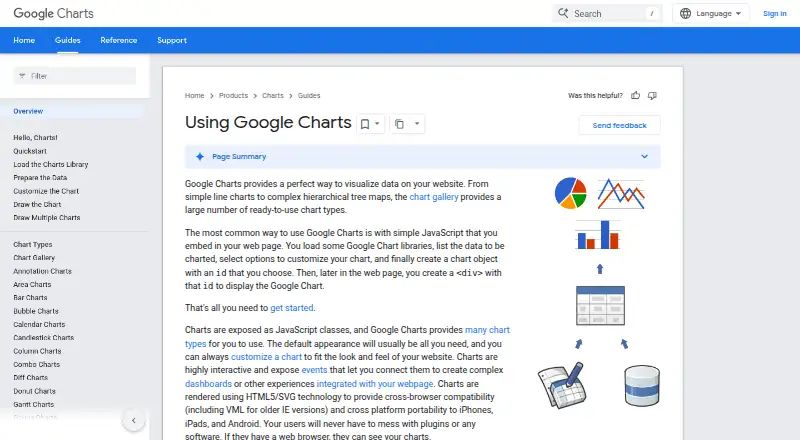
What Google Charts is
Google Charts provides chart types for visualizing data on websites, from line charts to hierarchical treemaps. It is free, and charts are commonly embedded in a webpage using JavaScript, a chart object, and a matching div element. You can customize their appearance and connect chart events to dashboards or other webpage experiences. Rendering uses HTML5 and SVG, with VML support for older Internet Explorer versions, and requires no user plugins. Listed data sources include webpages, databases, Google Spreadsheets, Google Fusion Tables, Salesforce, and providers compatible with the Chart Tools Datasource protocol. The protocol is implemented by Google Spreadsheets, Google Fusion Tables, and third-party providers such as Salesforce. Interactive charts require access to Google's gstatic loader, and the terms do not allow downloading or locally hosting the visualization code. Google says data sent to its servers for rendering is kept briefly for debugging and then discarded, subject to limited legal exceptions. Its FAQ says the Visualization API is available for commercial use under its terms. Google provides a user discussion forum and an issue tracker for suggestions.
Good
- Free to use
- Offers chart types from lines to hierarchical treemaps
- Charts can be customized and connected through events
- Uses HTML5 and SVG without user plugins
Watch out
- Interactive charts require access to Google's gstatic loader
- Visualization code cannot be downloaded or hosted locally
- Google says chart data is briefly retained for debugging
Who it suits
Google Charts suits people who want to embed customizable charts in websites or connect visualizations into dashboards. It may fit developers who can load the chart code from Google’s servers and work with JavaScript.
Verdict
Google Charts offers free, customizable visualizations for websites, with several listed data-source options. Its reliance on Google’s loader and restriction on local hosting are important considerations for deployment.
Plans and prices
From Google Charts's own pricing page, checked 3 Oct 2026.
| Plan | Price | What it gives you |
|---|---|---|
| Google Charts | Free | Free service · interactive code must be loaded from Google’s servers |
The facts
Each one read from Google Charts's own pages, with the date it was checked.
What it does
- Chart gallery
- The chart gallery includes ready-to-use chart types ranging from line charts to hierarchical treemaps.checked 3 Oct 2026
- Commercial use
- Google's FAQ says the Visualization API is available for commercial use, subject to its terms of service.checked 3 Oct 2026
- Customization
- Charts can be customized to fit a website’s look and feel.checked 3 Oct 2026
- Dashboard type
- interactivechecked 21 Sep 2026
- Data privacy
- Google says chart data sent to its servers for rendering is kept briefly for debugging and then discarded, and is not shared except for limited legal exceptions.checked 3 Oct 2026
- Data sources
- The DataTable class supports sorting, modifying, and filtering data and can be populated from a webpage, database, or compatible data provider.checked 3 Oct 2026
- Embedded dashboards
- Yeschecked 21 Sep 2026
- Integrations
- The Chart Tools Datasource protocol is implemented by Google Spreadsheets, Google Fusion Tables, and third-party providers such as Salesforce.checked 3 Oct 2026
- Interactions and dashboards
- Charts expose events that can connect charts into dashboards or other webpage experiences.checked 3 Oct 2026
- JavaScript integration
- Charts are commonly embedded in a webpage using JavaScript, a chart object, and a matching div element.checked 3 Oct 2026
- Offline and hosting limit
- Interactive charts require access to Google's gstatic loader, and the terms do not allow downloading or locally hosting the visualization code.checked 3 Oct 2026
- Purpose
- Google Charts provides chart types for visualizing data on websites.checked 3 Oct 2026
- Release cadence
- Google says it continually improves Charts, with new releases every few months.checked 3 Oct 2026
- Rendering
- Charts use HTML5 and SVG, with VML support for older Internet Explorer versions, and require no user plugins.checked 3 Oct 2026
- Scheduled refresh
- Yeschecked 21 Sep 2026
- Support
- Google provides a user discussion forum and an issue tracker for suggestions to its developer team.checked 3 Oct 2026
- Third-party chart risk
- Google says third-party charts run JavaScript and may contain vulnerabilities, and advises users to inspect whether a chart sends data to third-party sites.checked 3 Oct 2026
Money
- Free plan
- Yeschecked 21 Sep 2026
Where it runs
- Platform
- webchecked 21 Sep 2026