SAS Visual Statistics
SAS Visual Statistics is a statistical modeling and visualization product on SAS Viya, designed to take users from raw data analysis toward strategic action.
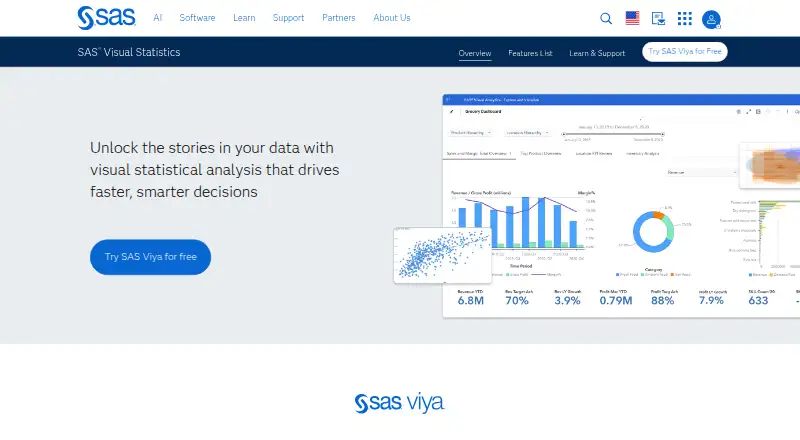
What SAS Visual Statistics is
SAS Visual Statistics is a statistical modeling and visualization product on SAS Viya, designed to take users from raw data analysis toward strategic action. Users can build models visually, adjust variables and remove outliers, then see how changes affect outcomes. Multiple users can work with the same data model, while the environment supports Python, R and SAS. Listed methods include clustering, decision trees, linear and logistic regression, generalized linear and additive models, and nonparametric logistic regression. Data imports include SAS data sets, Excel, delimited text, CSV, DTA, JMP, Parquet and SPSS. Programmers can access the Viya CAS server through SAS Studio, PROC CAS, Python, R, Lua, Java and public REST APIs. Native Pandas DataFrame integration supports transferring DataFrames to CAS and retrieving results for use with tools including matplotlib, Plotly and Bokeh. SAS Cloud Analytic Services processes data in memory and distributes processing across cluster nodes. Pricing is available on request; no free plan is listed, but a free trial is available.
Good
- Users can visually build and adjust models.
- Multiple users can collaborate on a shared data model.
- Supports Python, R and SAS in one environment.
- Imports a range of statistical and tabular data formats.
- CAS distributes in-memory processing across cluster nodes.
Watch out
- No free plan is listed.
- Pricing is available on request.
- Listed platforms are self-hosted and web.
Who it suits
It suits analysts and data science teams that need visual statistical modeling, collaboration and a choice of Python, R or SAS. Programmers can also use the CAS server through several languages and APIs.
Verdict
SAS Visual Statistics combines interactive model building with a broad set of statistical techniques, data imports and programming access. It is a paid product with pricing on request and a free trial listed.
Plans and prices
From SAS Visual Statistics's own pricing page, checked 30 Sep 2026.
| Plan | Price | What it gives you |
|---|---|---|
| SAS Visual Statistics | Priced on request | Runs on SAS Viya · enterprise-scale statistical modeling |
The facts
Each one read from SAS Visual Statistics's own pages, with the date it was checked.
What it does
- Collaboration
- Multiple users can interact with the same data model to collaborate on model development.checked 30 Sep 2026
- Data import formats
- SAS data sets, Excel (XLS/XLSX), delimited text files, CSV, DTA, JMP, Parquet, SPSSchecked 24 Sep 2026
- Deployment
- SAS Viya supports cloud, hybrid and on-premises deployment environments.checked 30 Sep 2026
- Governance
- SAS Viya provides governance, lineage and auditability across data sources and platforms.checked 30 Sep 2026
- Language support
- The product supports using Python, R or SAS interchangeably in a unified environment.checked 30 Sep 2026
- Licensing limit
- SAS Visual Analytics and SAS Visual Statistics are designed to work together but are separately licensed.checked 30 Sep 2026
- Model building
- Users can visually build models, adjust variables, remove outliers and immediately see how changes affect outcomes.checked 30 Sep 2026
- Product components
- The technology includes SAS Visual Analytics, SAS/GRAPH and SAS/STAT.checked 30 Sep 2026
- Programming access
- Programmers can access the SAS Viya CAS server through SAS Studio, PROC CAS, Python, R, Lua, Java and public REST APIs.checked 30 Sep 2026
- Purpose
- SAS Visual Statistics on SAS Viya provides interactive statistical visualizations and analytical modeling from raw data to strategic action.checked 30 Sep 2026
- Python integration
- Native Python Pandas DataFrame integration lets programmers upload DataFrames to CAS and retrieve CAS results as DataFrames for use with packages such as Pandas, matplotlib, Plotly and Bokeh.checked 30 Sep 2026
- Regression models
- Yeschecked 24 Sep 2026
- Runtime
- SAS Cloud Analytic Services processes data in memory and distributes processing across nodes in a cluster.checked 30 Sep 2026
- Scripting support
- Yeschecked 24 Sep 2026
- Security and compliance
- SAS Trust Center covers security, privacy, compliance, quality, AI governance and digital sovereignty.checked 30 Sep 2026
- Statistical techniques
- The feature list includes clustering, decision trees, linear regression, logistic regression, generalized linear models, generalized additive models and nonparametric logistic regression.checked 30 Sep 2026
- Statistical tests
- Yeschecked 24 Sep 2026
- Support
- SAS provides Visual Statistics documentation, tutorials, communities and technical support through its support site.checked 30 Sep 2026
The company
- Founded
- 1976checked 28 Sep 2026
- Headquarters
- Cary, North Carolina, USAchecked 28 Sep 2026