Dataplot
Dataplot is a free desktop system for scientific visualization, statistical analysis, and nonlinear modeling.
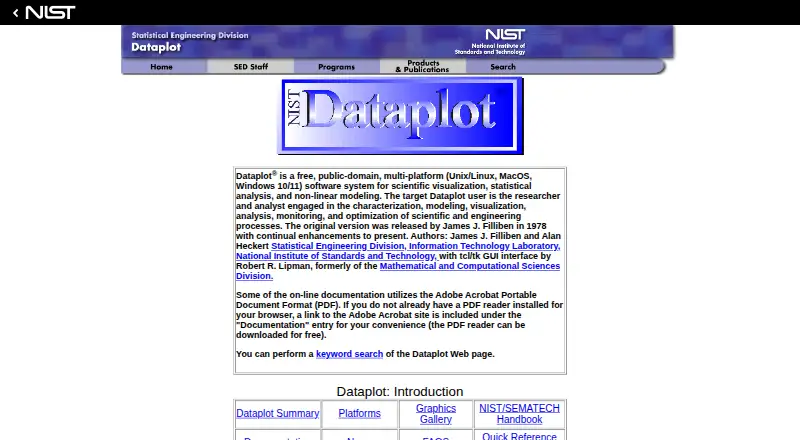
What Dataplot is
Dataplot is a free desktop system for scientific visualization, statistical analysis, and nonlinear modeling. NIST describes it for researchers and analysts working with scientific and engineering processes. Its tools cover statistical and mathematical analysis, fitting, time-series work, reliability, statistical process control, statistical tests, and regression models. Dataplot uses an interactive, high-level language with free-format, English-like syntax and commands for graphics, fitting, data analysis, and mathematics. It creates 2D and 3D graphics, contours, color plots, multi-trace and multi-plot graphics, as well as presentation and summary graphics. Imports include delimited ASCII text, limited Fortran unformatted binary, and Excel workbooks through READ EXCEL. The default workspace holds 10 variables by 1,000,000 rows, or 10,000,000 data points. It is available for Windows, Linux/Unix, and macOS; the Windows distribution is for Windows 10/11, while Linux/Unix and macOS builds are made from source. Its GUI uses Tcl/Tk scripts that must be installed separately. NIST does not guarantee support and provides it as staff time allows, prioritizing NIST staff.
Good
- Includes statistical tests and regression models.
- Supports time-series, reliability, and process-control analysis.
- Creates 2D, 3D, and summary graphics.
- Imports delimited text and Excel workbooks.
- Available for Windows, Linux/Unix, and macOS.
Watch out
- Tcl/Tk scripts for the GUI require separate installation.
- Linux/Unix and macOS distributions are built from source.
- NIST support is not guaranteed.
- No native smartphone or tablet installation is provided.
Who it suits
Dataplot may suit researchers and analysts working with scientific or engineering processes who need statistical, mathematical, and graphics capabilities. Users should be comfortable with its interactive command language and platform-specific installation requirements.
Verdict
Dataplot combines a broad range of scientific analysis and visualization tools with an interactive command language. Installation differs by platform, and users should not expect guaranteed support.
Plans and prices
From Dataplot's own pricing page, checked 11 Oct 2026.
| Plan | Price | What it gives you |
|---|---|---|
| Dataplot | Free | Free, public-domain software · no official support guaranteed |
The facts
Each one read from Dataplot's own pages, with the date it was checked.
What it does
- Analysis capabilities
- Its capabilities include statistical and mathematical analysis, graphics, fitting, time-series analysis, reliability, and statistical process control.checked 11 Oct 2026
- Data capacity
- The default workspace supports 10 variables by 1,000,000 rows, totaling 10,000,000 data points.checked 11 Oct 2026
- Data import formats
- ASCII text (space-, comma-, or tab-delimited); limited Fortran unformatted binary; Excel workbooks via READ EXCELchecked 24 Sep 2026
- Deployment
- desktopchecked 24 Sep 2026
- Distribution
- Dataplot is available for web download, and NIST says it no longer distributes the software on CD.checked 11 Oct 2026
- Extensibility
- Users can extend Dataplot with command macros, modify GUI menu files, or augment its source code.checked 11 Oct 2026
- Graphics
- It supports 2D, 3D, contour, color, multi-trace, and multi-plot graphics, along with presentation and summary graphics.checked 11 Oct 2026
- GUI
- The graphical interface uses Tcl/Tk scripts, which must be installed separately from Dataplot.checked 11 Oct 2026
- Integrations
- Dataplot can generate PostScript graphics and offers an option to convert PostScript plots to PDF.checked 11 Oct 2026
- Intended users
- NIST describes its target users as researchers and analysts working with scientific and engineering processes.checked 11 Oct 2026
- Language
- Dataplot is an interactive, high-level language with free-format, English-like syntax and commands for graphics, fitting, data analysis, and mathematics.checked 11 Oct 2026
- Mobile support
- Dataplot does not provide native installations for smartphones or tablets; its FAQ says Android may be possible through a Linux installation but has not been explicitly tested.checked 11 Oct 2026
- Purpose
- Dataplot is a software system for scientific visualization, statistical analysis, and nonlinear modeling.checked 11 Oct 2026
- Regression models
- Yeschecked 24 Sep 2026
- Scripting support
- Yeschecked 24 Sep 2026
- Statistical tests
- Yeschecked 24 Sep 2026
- Support
- NIST says support is not guaranteed, is provided when staff time allows, and prioritizes NIST staff; a Dataplot mailing list is available.checked 11 Oct 2026
The company
- Founded
- 1978checked 19 Oct 2026
- Headquarters
- Gaithersburg, Maryland, United Stateschecked 19 Oct 2026
Money
- Free plan
- Yeschecked 24 Sep 2026
Where it runs
- Linux and macOS
- Linux/Unix and macOS distributions are built from source, and the source code is available on GitHub.checked 11 Oct 2026
- Windows
- The Windows distribution is a binary installation for Windows 10/11.checked 11 Oct 2026