atop
atop is a free, GPL-licensed performance monitor for Linux, displayed in a full-screen, character-based interface.
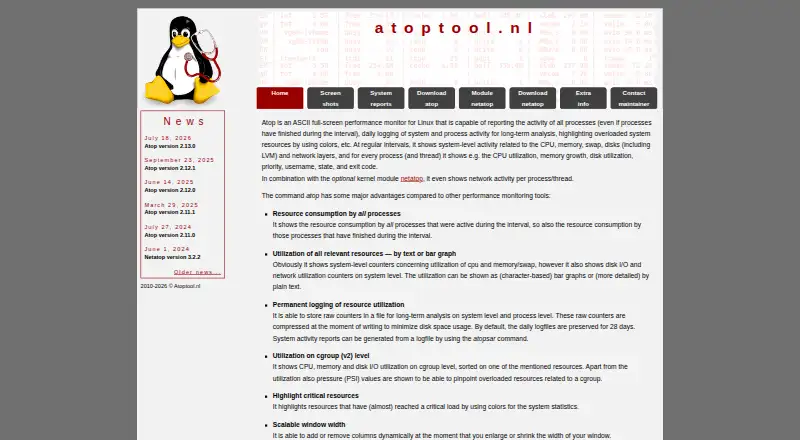
What atop is
atop is a free, GPL-licensed performance monitor for Linux, displayed in a full-screen, character-based interface. At regular intervals it reports system CPU, memory, swap, disk, and network activity, along with process and thread details such as CPU use, memory growth, and disk use. It also records resource consumption for processes that finish during a monitoring interval. For longer-term analysis, atop can save compressed raw counters; daily log files are kept for 28 days by default, and the atopsar command generates system activity reports from those logs. At the cgroup v2 level, it reports CPU, memory, and disk I/O utilization and pressure. An optional netatop kernel module adds TCP and UDP packet counts and bandwidth statistics per process and thread. The interface can show character-based bar graphs or detailed text, adjusting columns to fit terminal width. The download page lists a source archive and an x86_64 RPM package for version 2.13.0, with only a limited number of distribution-specific packages. The download page also describes the software as experimental and offered as-is, with limited guarantees and liability, and disclaims warranty for data loss or damage.
Good
- Tracks system and process activity.
- Includes finished-process resource consumption.
- Keeps daily logs for 28 days by default.
- atopsar generates reports from logs.
- Can show character-based bar graphs.
Watch out
- Only a limited number of distro-specific packages are listed.
- Per-process network statistics require the optional netatop module.
- The download page describes it as experimental.
- Offered as-is with limited guarantees and liability.
Who it suits
atop suits Linux users who want interval-based views of system and process activity, including users reviewing saved logs or cgroup v2 utilization. The maintainer’s performance analysis and tuning course covers atop and related tools.
Verdict
atop provides a broad Linux activity view and options for retaining and reporting log data. Check the available package formats and the download page’s stated limits and warranty disclaimer before choosing it.
Plans and prices
From atop's own pricing page, checked 8 Oct 2026.
| Plan | Price | What it gives you |
|---|---|---|
| atop | Free | GPL-licensed · Linux performance monitor |
The facts
Each one read from atop's own pages, with the date it was checked.
What it does
- Cgroups
- Atop reports CPU, memory, and disk I/O utilization and pressure values at cgroup v2 level.checked 8 Oct 2026
- Display options
- Atop can display utilization as character-based bar graphs or detailed text, and dynamically adds or removes columns as the terminal width changes.checked 8 Oct 2026
- Download formats
- The download page lists a source archive and an x86_64 RPM package for version 2.13.0, and says only a limited number of distro-specific packages are available there.checked 8 Oct 2026
- Finished processes
- Atop reports resource consumption by processes that finished during the monitoring interval.checked 8 Oct 2026
- Intended users
- The maintainer lectures a four-day Linux Performance Analysis and Tuning training course that covers atop and related tools.checked 8 Oct 2026
- License and warranty
- The download page identifies the license as GPL and says the software is offered as is, with limited guarantees and liability; it also disclaims warranty for data loss or damage and calls the software experimental.checked 8 Oct 2026
- Long-term logs
- Atop can store compressed raw counters for long-term analysis, and daily log files are preserved for 28 days by default.checked 8 Oct 2026
- Optional network module
- The optional netatop kernel module adds TCP and UDP packet counts and bandwidth statistics per process and thread.checked 8 Oct 2026
- Purpose
- Atop is an ASCII full-screen performance monitor for Linux that reports system and process activity.checked 8 Oct 2026
- Reports
- The atopsar command generates system activity reports from atop log files.checked 8 Oct 2026
- Resource monitoring
- At regular intervals it reports CPU, memory, swap, disk, and network activity at system level, along with CPU use, memory growth, disk use, and other statistics for processes and threads.checked 8 Oct 2026
- Support
- The site provides a contact form for the maintainer, Gerlof Langeveld.checked 8 Oct 2026
Alternatives to atop
- 1

PM2
Free planOpen sourceWebAPILinuxmacOS8.1From $79 a month - 2
Glances
Free planOpen sourceAndroidWebAPILinux8.0Free plan - 3
Process Lasso
Free planWindows7.4From $14.97 a year - 4

Ambih Monitor
Free planWindows7.2From $55 a year - 5
runit
Free planOpen sourceLinuxmacOSSelf-hosted7.0Free plan - 6
Remote Process Explorer
Free planWindows6.4$149.95 one-time