iFactory OEE Analytics
iFactory OEE Analytics tracks Availability, Performance, and Quality across production lines in real time, with the aim of identifying production losses.
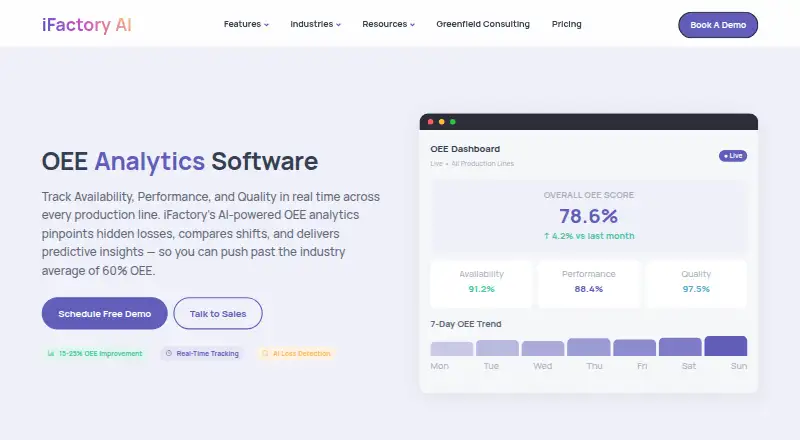
What iFactory OEE Analytics is
iFactory OEE Analytics tracks Availability, Performance, and Quality across production lines in real time, with the aim of identifying production losses. It collects information from PLCs, IoT sensors, SCADA systems, and manual inputs, and calculates OEE as Availability × Performance × Quality. Losses are classified with the Six Big Losses framework. A dashboard provides live OEE scores and views that can be drilled down from plant to line, machine, and component. Alerts can be sent by SMS, email, or push notification when OEE drops below a target. The listed AI analysis correlates downtime, speed, quality, and environmental data to identify root causes and recommend actions. Forecasts cover the next shift, day, and week; the page states 91% forecast accuracy. Analytics compare shifts, lines, machines, products, and time periods. Deployment options include cloud SaaS, on-premise server and hardware, and Greenfield projects. Pricing is by custom quote; cloud pricing depends on users, modules, and production lines. On-premise deployment offers data sovereignty and offline capability.
Good
- Tracks Availability, Performance, and Quality in real time.
- Accepts PLC, sensor, SCADA, and manual data.
- Alerts can use SMS, email, or push notifications.
- Compares performance across shifts, lines, and machines.
- Offers cloud, on-premise, and Greenfield deployment.
Watch out
- Pricing requires a custom quote.
- Cloud quote depends on users, modules, and production lines.
- On-premise server and hardware pricing is custom.
- Forecast accuracy is stated as 91%.
Who it suits
It suits production teams that need to monitor OEE, investigate losses, and compare performance across lines or shifts. Organizations choosing deployment can consider cloud SaaS, on-premise, or Greenfield options.
Verdict
iFactory OEE Analytics combines live OEE tracking with loss analysis, alerts, comparisons, and forecasts. Buyers need a custom quote, with deployment and production scope affecting the listed pricing options.
Plans and prices
From iFactory OEE Analytics's own pricing page, checked 2 Oct 2026.
| Plan | Price | What it gives you |
|---|---|---|
| Cloud-Based SaaS | Priced on request | Custom quote based on users, modules & production lines |
| Greenfield Plant | Priced on request | Custom quote; end-to-end project scoping & consultation |
| On-Premise Server & Hardware | Priced on request | Custom quote based on hardware, modules & deployment scope |
The facts
Each one read from iFactory OEE Analytics's own pages, with the date it was checked.
What it does
- AI analysis
- The page says AI correlates downtime, speed, quality, and environmental data to identify root causes and recommend corrective actions.checked 2 Oct 2026
- Alerts
- Threshold alerts can be sent by SMS, email, or push notification when OEE falls below a target.checked 2 Oct 2026
- Comparisons
- The analytics compare OEE across shifts, production lines, machines, products, and time periods.checked 2 Oct 2026
- Dashboard
- The dashboard provides live OEE scores and drill-down views from plant to line, machine, and component.checked 2 Oct 2026
- Data collection
- The product collects machine data from PLCs, IoT sensors, SCADA systems, and manual inputs.checked 2 Oct 2026
- Deployment
- The maker lists cloud SaaS, on-premise server and hardware, and Greenfield deployment models; cloud pricing is a custom quote based on users, modules, and production lines.checked 2 Oct 2026
- Forecasting
- OEE forecasts cover the next shift, day, and week, and the page states 91% forecast accuracy.checked 2 Oct 2026
- Integrations
- The page lists PLC, SCADA, and sensor data feeds, plus ERP production synchronization with SAP, Oracle, and Dynamics.checked 2 Oct 2026
- OEE calculation
- It calculates OEE in real time as Availability × Performance × Quality and classifies losses using the Six Big Losses framework.checked 2 Oct 2026
- Protocols
- The FAQ says machine connectivity supports OPC-UA and Modbus, IoT sensor gateways, touchscreen operator input, and API integration with MES or ERP systems.checked 2 Oct 2026
- Purpose
- OEE Analytics tracks Availability, Performance, and Quality in real time across production lines and identifies production losses.checked 2 Oct 2026
- Security and data control
- The pricing page says on-premise deployment offers data sovereignty, privacy, and air-gapped or offline capability.checked 2 Oct 2026
- Support
- The support page lists an address in Sunnyvale, California, a phone number, and an email contact.checked 2 Oct 2026
The company
- Headquarters
- 440 N. Wolfe Road, Sunnyvale, CA 94085, USAchecked 28 Sep 2026
Where it runs
- Mobile apps
- The cloud platform listing includes a mobile app for iOS and Android.checked 2 Oct 2026
Alternatives to iFactory OEE Analytics
- 1

TeepTrak
Free planAndroidiOSWebAPI7.4Free plan - 2

Peakboard OEE Software
Free planWebAPISelf-hostedWindows7.0From $1,400 a year - 3

SYMESTIC OEE Software
AndroidiOSWebAPI6.9From €850 a month - 4
OpeEye
AndroidiOSWeb6.7From ₹399 a month - 5
Shoplogix
AndroidiOSWebAPI6.7From $25 a month - 6

Factbird
WebAPI6.5From $399 a month